Nestle Dividend Stock Analysis
Company Overview
 Nestle SA (PINK: NSRGY.PK) is a Swiss Company engaged in the nutrition, health and wellness sectors. It is the holding company of the Nestle Group, which comprises subsidiaries, associated companies and joint ventures throughout the world. It has such business units as Food and Beverage, Nestle Waters and Nestle Nutrition. It is also active in the pharmaceutical sector.
* Unless otherwise noted, numbers used in this analysis are in Swiss Francs (CHF)
EPS, Dividends
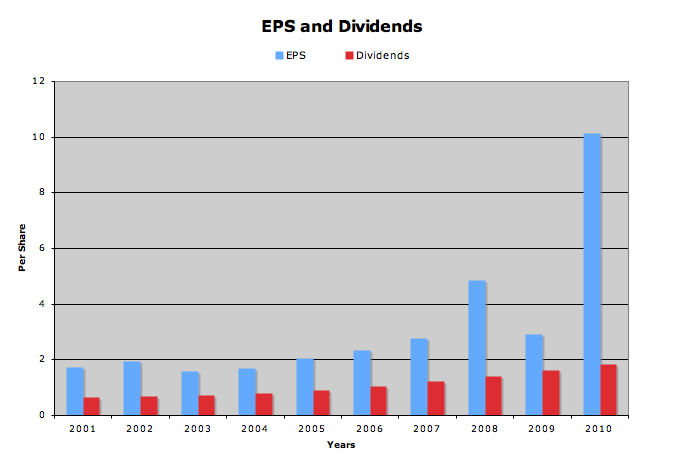
In 2010 Nestle completed it’s sale of Alcon, a world-wide leader in eye care. The sale of this business had a realized gain of 24.5 billion CHF, which greatly pads the eps, net margin, and return on equity of 2010. Without this additional CHF 7.52, eps per diluted share attributable to continuing operations was only 2.60, which is a decrease of 10.7% from 2009′s 2.91 per share.
Dividend growth for the past year was a staggering 15.6%, from CHF 1.60 to 1.85. Free cash flow has grown by an average of 4.8% for the past 5 years, and 2010′s fcf of 9 billion is more than enough to cover the 5.4 billion paid out to shareholders.
Expected Earnings
- FY 2011 – 3.54
Analyst expect a 5 year growth rate of 6%.
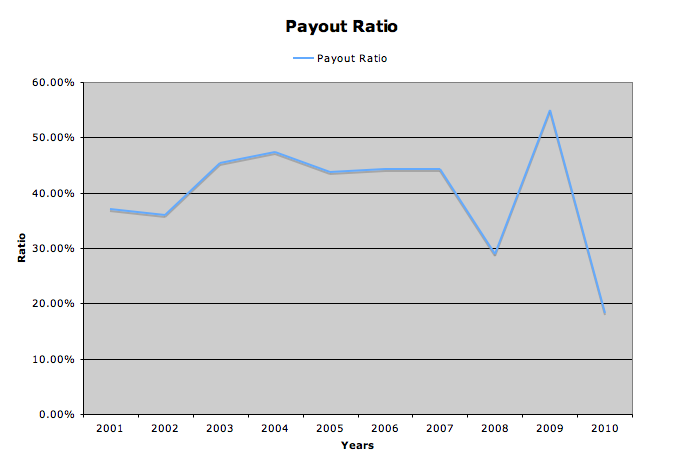
Payout ratio plummeted in 2010, once again due to the profit from the sale of Alcon. However, we can see that over the years, Nestle has done a good job of keeping the payout ratio steady around 40%.
Revenue and Margins
| Years | Revenue (in millions) |
|---|---|
| 2001 | 84,698 |
| 2002 | 89,160 |
| 2003 | 87,979 |
| 2004 | 86,679 |
| 2005 | 91,115 |
| 2006 | 98,458 |
| 2007 | 107,552 |
| 2008 | 109,908 |
| 2009 | 107,618 |
| 2010 | 109,722 |
Revenue growth is a bit on the slow side, averaging 2.89% over the past decade. 2010 sales grew by 1.95% over 2009, which would seem that sales growth is slowing down. But with sales of over 100 billion, one cannot expect double-digit growth rates.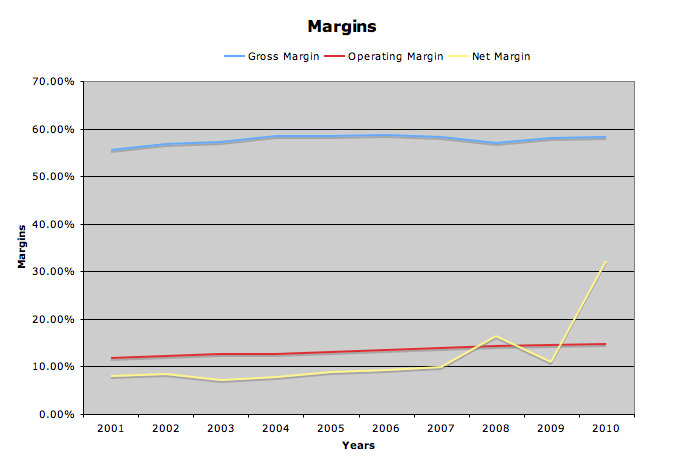
Margins have remained stable, except for net margin, which as explained before, has been skewed by Alcon. Otherwise, margins look good, especially after two weeks of Tootsie Roll’s and Hershey’s margins, which are very erratic.
Balance Sheet
Nestle has a solid balance sheet. Debt represents only 24% of the capital structure, and total debt to equity is 0.32. With 8 billion dollars in cash, and an interest coverage ratio of 19.1, Nestle should not have any liquidity or debt problems.
Returns
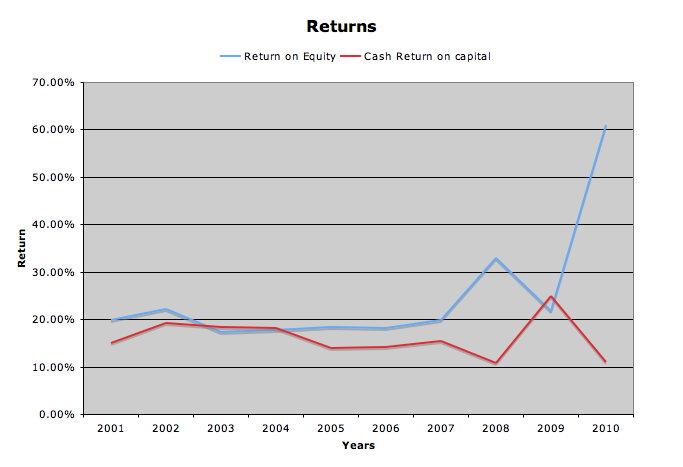
Returns have been steady, and ROE has a 10 year average of 25%, though this number is artificially high due to 2010′s increase in net income. Even if we knock off a few percentage points, it is still a respectable ROE. Cash return on capital is also laudable, with a 10 year average of 16.1%.
Stock Price Valuations (in dollars)
current price - 56.40
5 year low p/e - 16.4
p/e (ttm) - 5.18 (21.69 without Alcon profit)
p/e (forward) - 15.93
peg - 0.9
5 year high dividend yield - 2.7%
dividend yield - 3.5%
Conclusion
While I find Nestle attractively valued at 15.9 times forward earnings and a respectable dividend yield, I do not have complete confidence in my grasp of their business, or of the financial implications that come from buying a dividend paying Swiss company. So until I conduct further and more detailed research, I will be sitting this one out.
To get all my updates, please subscribe to my rss feed
Full Disclosure: I do not own any NSRGY.PK. My Current Portfolio Holdings can be seen here
{ 2 comments… read them below or add one }
Wow that’s a massive jump in EPS in 2010! I wonder how they will perform this year.
Hey Dividend Pig,
As a Canadian Investor, foregin dividends and captital gains get unfavourable tax treatment (ie US Stocks) – therefore I would hold them in my RRSP (the equivalent of your IRA) where any gains or dividends are sheltered. I am assuming its exactly the same scenario in the U.S.
I don’t think you need to worry about the business model with Nestle – they are a well established global empire In my opinion the only considerations are looking at the price chart over the 1-5 year period, and if you are paying high commissions or fees to purcahse. Why not go with a good global ETF instead, that gives you exposure to European multinationals like Nestle? You have so many in the U.S. to choose from.
PS I enjoy your blog.