Johnson & Johnson: Dividend Stock Analysis - Seeking Alpha
Summary
Johnson & Johnson (JNJ) is a classic blue chip company that has raised dividends for 48 straight years and is currently trading at a historically lower-than-average valuation.
- Revenue Growth (5 Year): 4%
- Earnings Growth (5 Year): 6%
- Diluted EPS Growth (5 Year): 7%
- Cash Flow Growth (5 Year): 7%
- Dividend Growth (5 Year): 10.5%
- Dividend Yield: 3.60%
- Balance sheet is remarkably conservative.
Overall, I feel that despite the recent string of recalls that has tarnished the company’s reputation, there is significant value in this company and stock. A perfect storm of the financial collapse and health care reform in the United States, along with near-simultaneous internal company problems with McNeil, has resulted in uncharacteristically lackluster performance of the company, and a historically low valuation of the stock. I conclude that over the long term, JNJ is a solid buy at the current price. Click on all charts to enlarge:


Overview
Johnson and Johnson is a diverse global health care company with approximately half of their revenue coming from outside the United States. Founded in 1886, the company has paid increasing dividends for 48 consecutive years and is therefore firmly among the dividend aristocrats. The company has 139 manufacturing facilities consisting of 21.8 million square feet. JNJ is further broken down into three main business segments. Each of the three segments are among the largest worldwide entities in their respective fields.
Consumer Segment
Johnson and Johnson’s Consumer Segment sells a variety of name brand products including Listerine, Dabao (China), Neutrogena, Band-Aid, Tylenol, Carefree, Splenda, and of course Johnson’s Baby Care products. This segment was hit very hard in 2010 due to a string of serious recalls, and the result was that sales of this segment decreased 7.7% over the year.
| Aspect | Sales |
|---|---|
| Over the Counter | $4.6 billion |
| Skin Care | $3.5 billion |
| Baby Care | $2.2 billion |
| Women’s Health | $1.8 billion |
| Oral Care | $1.5 billion |
| Wound Care/Other | $1.0 billion |
Total Segment Sales: $14.6 billion
Pharmaceutical Segment
JNJ’s Pharmaceutical segment consists of a diverse and strong set of drugs.
| Drug | Sales |
|---|---|
| Remicade | $4.6 billion |
| Procrit/Eprex | $1.9 billion |
| Risperdal/Consta | $1.5 billion |
| Levaquin/Floxin | $1.4 billion |
| Concerta | $1.3 billion |
| Velcade | $1.1 billion |
| Aciphex/Pariet | $1.0 billion |
| Topamax | $0.5 billion |
| Other | $9.1 billion |
Total Segment Sales: $22.4 billion
Medical Devices and Diagnostics Segment
JNJ’s device and diagnostic segment has experienced fair growth, and houses Acuvue contact lenses, as well as diabetes care, endo-surgery products, and more. It’s worth noting that nearly every aspect of their medical devices segment experienced growth this past year.
| Aspect | Sales |
|---|---|
| DePuy | $5.6 billion |
| Ethicon Endo-Surgery | $4.8 billion |
| Ethicon | $4.5 billion |
| Vision Care | $2.7 billion |
| Cordis | $2.5 billion |
| Diabetes Care | $2.5 billion |
| Ortho-Clinical Diag. | $2.0 billion |
Total Segment Sales: $24.6 billion
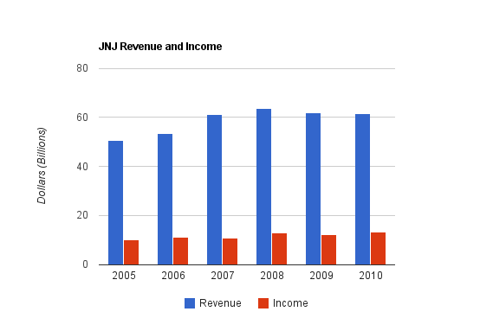
Revenue, Income, Cash Flow and Metrics
Johnson and Johnson has seen steady growth for the last several decades. The economic crisis in 2008 and 2009 has halted growth, and product recalls plagued their performance in 2010.
Revenue Growth
| Year | Revenue |
|---|---|
| 2010 | $61.587 billion |
| 2009 | $61.897 billion |
| 2008 | $63.747 billion |
| 2007 | $61.095 billion |
| 2006 | $53.324 billion |
| 2005 | $50.514 billion |
Johnson and Johnson has grown revenue by a compounded rate of 4% over this five-year period.
Income Growth
| Year | Net Income |
|---|---|
| 2010 | $13.334 billion |
| 2009 | $12.266 billion |
| 2008 | $12.949 billion |
| 2007 | $10.576 billion |
| 2006 | $11.053 billion |
| 2005 | $10.060 billion |
JNJ has grown income by a bit under 6% compounded annually over this five year period. Diluted EPS was $3.35 in 2005 and $4.78 in 2010, which represents a compounded EPS growth rate of approximately 7% over the same period.
Cash Flow Growth
| Year | Operational Cash Flow | Free Cash Flow |
|---|---|---|
| 2010 | $16.385 billion | $14.001 billion |
| 2009 | $16.571 billion | $14.206 billion |
| 2008 | $14.972 billion | $11.906 billion |
| 2007 | $15.249 billion | $12.307 billion |
| 2006 | $14.248 billion | $11.582 billion |
| 2005 | $11.799 billion | $9.167 billion |
Cash flow from operations has grown at a bit under 7% compounded annually over this period. Free Cash Flow grew at nearly 9% over the same period.
Metrics
- Price to Earnings: 12.5
- Price to FCF: 11.6
- Price to Book: 2.9
- Return on Equity: 23.5%
- Net Profit Margin: 21.6%
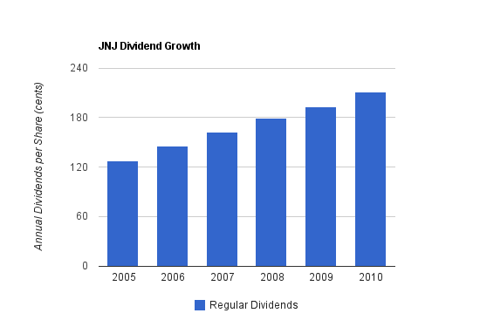
Dividends and Share Repurchases
Johnson and Johnson has been a solid dividend payer for decades. With a current dividend yield of over 3.60%, JNJ presents one of the highest yields it has had in years.
Dividend Growth
| Year | Dividend | Yield |
|---|---|---|
| 2010 | $2.11 | 3.50% |
| 2009 | $1.93 | 3.30% |
| 2008 | $1.795 | 2.90% |
| 2007 | $1.62 | 2.80% |
| 2006 | $1.455 | 2.40% |
| 2005 | $1.275 | 2.00% |
The dividend has grown at a rate of 10.5% over the last five years. The most recent quarterly increase, in early 2010, was from $0.49 to $0.54, representing a 10.2% increase. The payout ratio is approximately 45%.
In addition to paying dividends, JNJ repurchases shares to boost EPS and increase dividend growth. JNJ recently completed a $10 billion share repurchase plan that spanned three and a half years beginning in mid-2007.
Balance Sheet
Financially, JNJ is extremely stable. Their operations are diverse, and their balance sheet is superb. The current ratio is above 2, and the long term debt/equity ratio is only 0.16. Goodwill makes up less than a third of total shareholder equity, and the interest coverage ratio is well over 30. The company is one of the few non-financial companies to have an AAA credit rating.
Investing Thesis
One quarter of JNJ revenue is generated from products developed within the last five years. The company has a strong pharmaceutical pipeline with several potentially successful drugs. Relatively strong and widespread performance in the medical devices segment has partially offset the big hit that their consumer products segment took in 2010 (specifically in OTC and wound care products).
The company grows from a combination of organic growth from research and development, partnerships with other companies, and through acquisitions. JNJ’s recent large acquisition was Crucell, which involved a $2+ billion offer for the Dutch vaccine company. In addition to company growth, JNJ offers investors dividends and share repurchases to increase total shareholder returns at a rate that exceeds growth of the company.
Johnson & Johnson has a strong presence in emerging markets, including the BRIC countries of Brazil, Russia, India, and China. Double digit emerging market growth helps to offset lackluster performance in developed countries, and over the long-term, many developed countries have an aging population that will continue to require large amounts of medical treatment. The company, in June 2011, is opening up a medical devices and diagnostics research center in Suzhou, China to focus on emerging market growth. In 2009, the company opened up a late-phase pharmaceutical development center in Mumbai, India.
Consumer health products, pharmaceuticals, and medical devices are a universal need for humanity, and so the industry is perpetually necessary. A company like JNJ has patent protection, as well as brand name products and massive research and development sums to provide itself with a sturdy economic moat. Still, 2010 showcased how a breach in the moat can occur when management is not ensuring quality each and every day.
A company the size of JNJ, in order to provide shareholders with significant returns, needs to grow organically and through acquisitions, and by sending money back to shareholders in the form of dividends and reasonably-priced buybacks.
Risks
Johnson and Johnson combines elements of stability and risk. The company is large and extremely diversified, and protected by a collection of patent shields. The billions of dollars that they can spend on research and development provides them with a competitive advantage, and their distribution network is something difficult to replicate. The balance sheet is extremely conservative, the history of growth and increasing dividends is impressive, and profitability and cash metrics are strong. In addition, the modest valuation provides a significant margin of safety.
On the other hand, JNJ has showcased that bad quality control can affect multi-year profitability, and also reduce intangible benefits. The company claims that the recall problems are largely resolved and behind them, but this still shows the enormous complexity and extremely high standards that their products demand, and the continued excellence that must be maintained for this company to be successful for decades. Like all large health care companies, JNJ’s future profitability rests on its ability to develop or acquire successful drugs and devices, and to effectively patent and market them. The company must deal with heavy litigation that comes towards all firms in this field, and must effectively manage the strength of their brands. Their brands account for a huge mark-up for the prices they can charge on their consumer products. Even classic blue chip stocks are not “set it and forget it” investments. They must be monitored to ensure that they continue to meet expectations of the investor’s investment criteria.
Conclusion and Valuation
Overall, I think JNJ is a solid pick for dividend yield and growth right now. It’s a stable, incredibly diverse company with fair growth prospects and a large international exposure, and an above average dividend yield. The stock has lagged behind the 2 year broad stock run for good reasons, but with a P/E ratio of under 13 and a strong balance sheet, I find JNJ to be a solid buy.
A low valuation allows the company’s allocated share repurchases and shareholder’s personally reinvested dividends to accumulate more shares than they otherwise would if the valuation was higher.
Disclosure: Long JNJ. You can see my full list of individual holdings here.
No comments:
Post a Comment