10 by 10: The Interaction of Dividend Yield and Growth - Seeking Alpha
One of the most-referenced articles I have published is the original 10 by 10 method for understanding the interplay between dividend yield and dividend growth. I thought it would be good to update that article, introduce the concept to a new generation of dividend investors, and add a couple of new features.
There is a lot of discussion about the relative merits of high or low initial dividend yields (IY) compared to high or low dividend growth rates (DGR). Often this discussion comes up when someone says that he or she wants to find a “Dividend Champion of the Future.” The person is willing to accept a low initial yield if the company is relatively young and is raising its dividend very fast. At the opposite end of the spectrum, other investors state that they want high yields now and are willing to accept slower rates of growth (or even no growth, as would be the case with preferred stocks).
Which is better? A stock yielding 2.5% but raising its dividend 20% per year, or a stock yielding 8.5% but increasing it at only 1% per year? There is really no “correct” answer - it depends on your goals, which in turn probably turn on factors like your age, your timeframe, and what your current level of income generation actually is.
Most people instinctively understand that a low initial yield compounding at a very fast rate will eventually surpass a higher yield that is hardly increasing at all. There will be a crossover point. For example, a 3% initial yielder with a DGR of 20% per year will at some point permanently surpass the dividend return of a 5% initial yielder with a DGR of 5% per year. The question becomes, when do those lines cross? And as an investor, are you comfortable with how long that takes, or do you even care? Once they cross, of course, the initial lower yielder will be generating more annual income dollars than the initial higher yielder, and the gap will increase as the years pass.
The original 10 by 10 article provided a way to visualize the interaction of initial yield and DGR. It was based on the fact that the long-term dividend return of a stock is a function of how its initial dividend yield (that is, the yield at the time you buy it, or IY) combines with its annual dividend growth rate (DGR).
As a baseline, I selected this scenario: Let’s say that your goal is to build a portfolio whose return on your original investment - your “yield on cost” - will reach 10% within 10 years' time. I call this the "10 by 10" approach. It is the goal that I use in my own Dividend Growth Portfolio.
The two 10s are arbitrary. You can choose any goals you like. I chose 10 and 10 because:
- 10% is a healthy rate of return, almost equal to the long-term total return of the stock market itself. (Total return includes price appreciation plus dividends.)
- 10 years is a useful time frame for people of most ages. Young people, of course, have a much longer investment timeframe, but nevertheless may consider 10 years long enough to wait for the kind of dividend return they are seeking. Older people - say in their 60s and 70s - still often think in time frames at least as long as 10 years, since just by having lived to their current age, their life expectancy usually is longer than 10 years from right now.
- And, of course, 10 is a nice round number. It is easy to think in terms of 10% return and a 10-year timeframe to get a good grasp of the underlying principles.
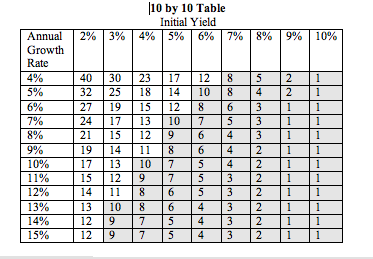
So the question is reduced to simple math: What IYs, growing at what DGRs, achieve the 10 by 10 goal - 10% yield on cost within 10 years? The following table answers that question. It shows initial yields across the top and annual growth rates down the side. Where any two values intersect, the table shows how many years it takes to achieve a 10% dividend return. Beneath the table are a few notes on calculation and interpretation.
Notes:
- The table ignores the contribution of price increases. It shows only the rate of return based on increases in the dividend over time.
- The rates of dividend increase should be considered average annual rates. It is rare for a company to increase its dividend by the same percentage each year.
- The table does not include the accelerating effect of reinvesting the dividends, which would shorten the times shown. It just shows the increase in yield on cost from growth in the dividend itself.
- In calculating the table's values, all years were rounded to the nearest year that a 10% return (from dividends alone) would be achieved. Thus all years appear as whole numbers. Returns were also rounded, so the year that a return reached 9.6% was counted as the year it hit 10%.
The "sweet spot" wherein the 10 by 10 goal is achievable has been shaded. So, for example, a 4% initial yield growing at 10% per year takes the same number of years as a 5% initial yield growing at 7% per year: Both reach a 10% return (from the dividend alone) in about 10 years.
There are a couple of interesting conclusions illustrated by this table.
- A 2% initial yield cannot reach the 10 by 10 goal at any rate of increase up to 15% per year. For that reason, many Dividend Champions (stocks that have increased their dividends for at least 25 years running) do not clear the 10 by 10 hurdle. This would include such common dividend-growth names as AFLAC (AFL) (2.0% yield), Archer-Daniels-Midland (ADM) (1.7%), and Hormel Foods (HRL) (1.9%).
- Second, the table demonstrates that, percent-for-percent, the IY carries more weight than the DGR. For example, an additional 1% in initial yield reduces by 2% to 4% the growth rate needed to reach 10% yield on cost in a given time. As a specific example, a jump in initial yield from 4% to 5% reduces the DGR needed to achieve the 10 by 10 goal by 3% per year.
This latter point is important. The faster you hit your 10% yield on cost, the fewer years that your stock choice is subject to what might be called “prediction risk" - the risk that you overestimated its rate of dividend growth. Your initial rate of return is fixed at the time of purchase, but the future rate of dividend growth is somewhat speculative. The higher the rate of projected dividend growth, the more risk that it may not actually be achieved.
So getting to your goal in fewer years is generally better all around. Looking again at some stocks owned by many dividend-growth investors, names like AT&T (T) (6.1%), Kimberly Clark (KMB) (4.3%), and Johnson & Johnson (JNJ) (3.5%), all yielding at least 3.5% to new purchasers, seem like better bets than the lower-yielding stocks named earlier, simply because their IY is higher.
As stated earlier, investors with other goals may plug in different numbers besides the 10 and 10 that I selected. Maybe you want to achieve 12% dividend yield on cost within nine years, or 10% within seven years. It is easy to modify the table to show the combinations of initial yield and dividend growth rate you need to achieve those goals. The underlying principles and simple math remain the same.
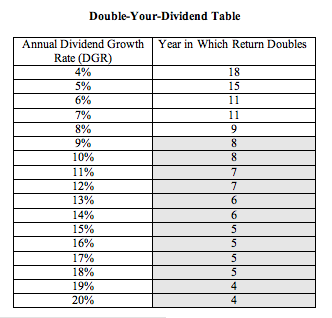
A few weeks ago, a commenter suggested a different perspective on the interaction of initial yield with DGR. He wanted to know how many years it would take his yield on cost to double the initial yield. (I believe he wanted to double his income in eight years.) Actually, this question is simpler than the 10 by 10 situation, because it does not matter what IY is. Doubling is a function of a single variable, the dividend growth rate (DGR). This table shows how many years it will take to double your income stream based on different DGRs.
Notes:
- Achievement of doubling is not rounded in this table. That is, 1.6x was not rounded up to 2 to represent doubling. The year shown is the year that the rising dividend stream actually meets or exceeds 1.99x.
- A close approximation to the years shown in this table can be derived by using the Rule of 72. This common rule of thumb is that if you divide the DGR into 72, the result is the number of years it will take your money to double. For example, if your return is increasing at 8% per year, it will take nine years to double (72 / 8 = 9). The rule is accurate within +/- one year at most DGRs.
- Because the goal was to double the dividend stream in eight years, those cells are shaded.
- As with the first table, this ignores the contribution of price increases. It shows the number of years to doubling your income based only on the DGR.
- As before, the rates of dividend increase should be considered average annual rates. It is rare for a company to increase its dividend by the same percentage each year.
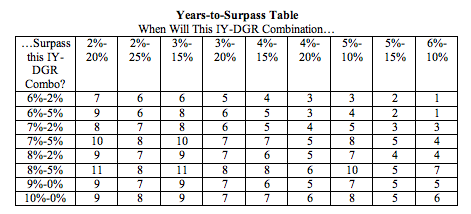
Finally, what about the question of the crossover point? When does a low initial yield (IY) with a high DGR surpass a high IY with low DGR? Here are some illustrative combinations of IYs and DGRs. The number in each cell is the year in which the IY-DGR combination across the top would cross over or surpass the IY-DGR combination down the left.
Notes:
- Units across the top and down the left are in percent. The number in each cell is the year during which the crossover takes place.
- As in the other tables, price increases are ignored, and the DGR should be considered an average as it is rare for a company to increase its dividend by the same percentage every year.
- Prediction risk is a significant factor here. It is asking a lot for any dividend-growth stock to increase its dividend 25% per year for as many as six-eight years.
By the way, a handy source for 1, 3, 5, and 10-year DGRs is David Fish’s excellent Dividend Champions/Challengers/Contenders document. The document shows those DGRs for every stock that have a five-year or longer streak of increasing its dividends.
I apologize if there are any calculation errors in these tables. Please let me know in the comments if you spot any. And as always, perform your own due diligence before purchasing any investment.
Disclosure: I am long T, KMB, JNJ.
No comments:
Post a Comment