Any owner of a business will tell you that the value of their business is based upon the earnings and cash flows it generates on their behalf. The more profitable the business is, the more valuable it is to its owners. In addition to just being common sense, this principle is also mathematically sound. When it comes to how much money the business makes, more money is better than less. Consequently, the more money the business makes for the owner, the higher the price they would ask if they decided to sell it. This would not be a surprise to any prospective buyer. What would surprise a prospective business buyer is finding a business that generates above-average earnings and cash flows being offered for sale at a below-average price. If a prospective business buyer was lucky enough to come across such a situation, they would quickly gobble it up. This would be especially true if they have already conducted due diligence and were therefore confident of the strength of the business. In the private sector, the good fortune of finding an above-average business offered at a below-average value very rarely happens. But, if for some strange stroke of good luck it did, the shrewd business buyer would be thankful for this extraordinary opportunity.
However, in the public sector, better known as the stock market, the irrational pricing of a publicly traded business is a more common occurrence. But, unlike the private sector, the public market is an auction where price points are continuously changing minute by minute. Consequently, buyers of businesses in the public market tend to focus more on price volatility than they do business values. A rising stock price tends to attract buyers, while a falling stock price tends to repel them. Therefore, a significant amount of buying high and selling low tends to occur.
On the other hand, common sense should once again dictate, that the value of the public business is derived from how much profit it generates, just as it does with the private business. The most renowned investors of our time understand these principles and although they speak to them often, it's often upon deaf ears. The following quotes, one from the venerable Warren Buffett and the other from investor extraordinaire Peter Lynch summarize what has been said so far:
"For some reason, people take their cues from price action rather than from values. What doesn't work is when you start doing things that you don't understand or because they worked last week for somebody else. The dumbest reason in the world to buy a stock is because it's going up." Warren Buffett"What makes stocks valuable in the long run isn't the market. It's the profitability of the shares in the companies you own. As corporate profits increase, corporations become more valuable and sooner or later, their shares will sell for a higher price." Peter Lynch, Worth Magazine, September 1995
The Average Company as our Benchmark
This article is going to look at five technology giants, first from the perspective of business results only, and later those business results will be correlated to public stock prices. But in order to establish a clear perspective and a benchmark to measure against, we will start by looking at the S&P 500. The following graphs look at this proxy for the average publicly traded business from the perspective of earnings and dividends only. In other words, the following graph focuses on the business results of the average company.
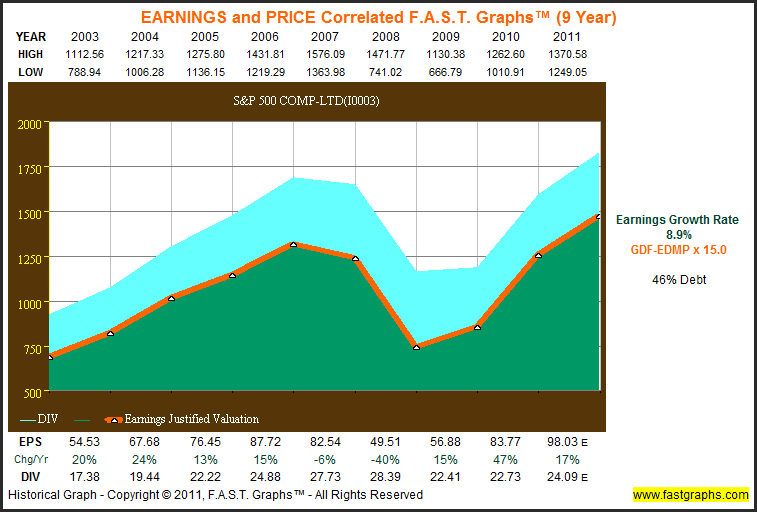
The S&P 500
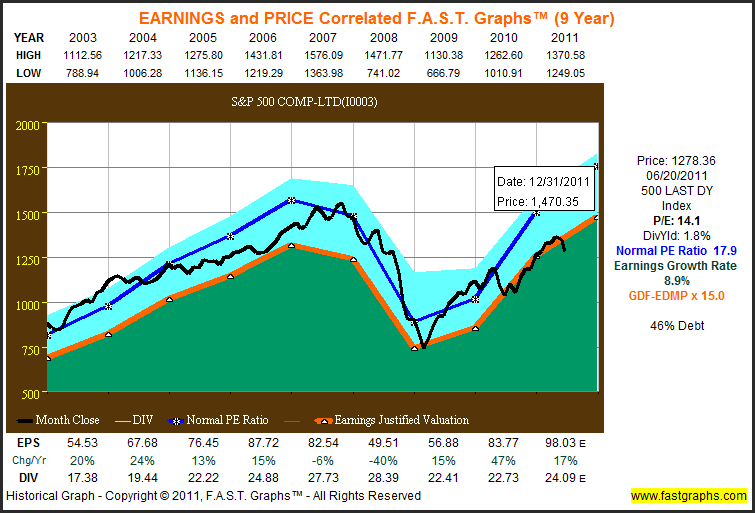
The orange line on the graph plots earnings-per-share since calendar year 2003. The green shaded area represents a mountain chart of those earnings, and the light blue shaded area depicts dividends paid out of the earnings (green shaded area). The 8.9% earnings growth rate is listed to the right of the graph. The orange line also represents an average PE ratio of 15 which is calculated based on a widely accepted formula for valuing a business. Therefore, it's no coincidence that a 15 PE ratio also happens to be the historical average for the S&P 500 over the past 150 years.
To summarize and clarify, the average company as represented by the S&P 500 has grown earnings at the rate of 8.9%, and those earnings are typically valued at an average or normal PE ratio of 15. The graph also illustrates a great deal of cyclicality in the earnings performance of the average company. A quick glance at the bottom of the graph shows that the average company experienced a fall in earnings of 6% in 2007 and 40% during the recession of 2008. Therefore, our benchmark is earnings growth of less than 10% on average, with cyclicality and uncertainty during weak economic times.
(Click to enlarge)
Here is what our Five Technology Giants have Earned
We're going to review our five technology giants in a specific order that will be revealed later in the article. Also, since each of these five technology companies are well known, we're going to dispense with any descriptions or discussions about what they do. This exercise is going to be strictly by the numbers, where we ask the reader to keep the benchmark S&P 500 numbers in mind as we review each example.
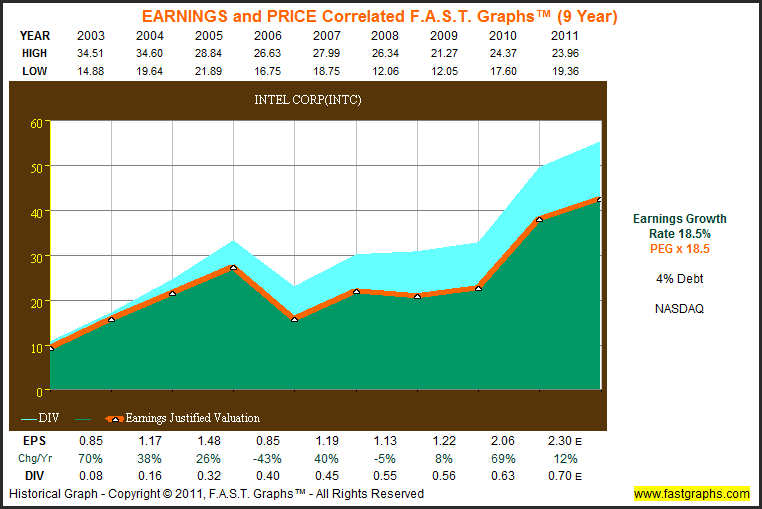
Intel Corp. (INTC)
Our first example is Intel Corp. As will become evident as we review the other four companies, Intel is the most cyclical of the group. Nevertheless, as the graph below depicts, Intel has grown earnings at the above-average rate of 18.5%, which is more than twice as fast as the average company. Furthermore, Intel only has 4% debt on the balance sheet as compared to over 46% debt for the average company. So even with cyclicality that's similar to the S&P 500, Intel clearly represents an above average business.
(Click to enlarge)
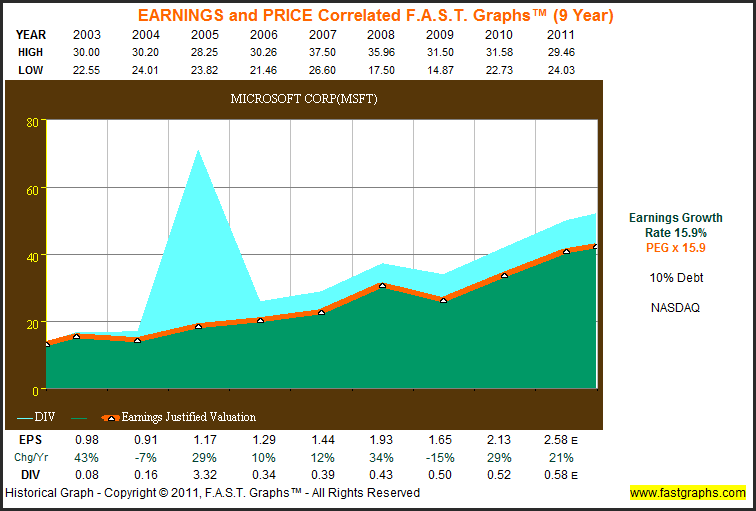
Microsoft Corp. (MSFT)
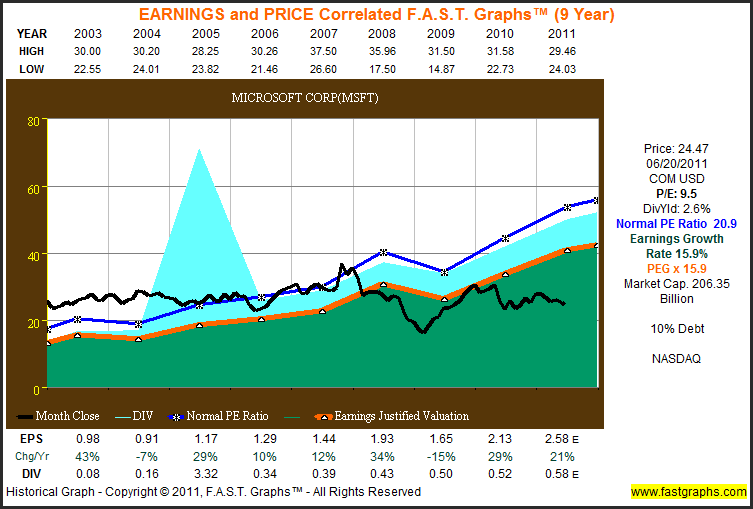
Our second example reviews Microsoft Corp. Once again, we see above-average earnings growth of 15.9% and only 10% debt. Even though they are a prodigious generator of cash flow, Microsoft has only been paying dividends since calendar year 2003. However, note by the big spike in the light blue shaded area (dividends), that Microsoft paid a special three dollar per share dividend in 2005. Clearly, Microsoft has consistently grown earnings at an above-average rate, and even their 15% drop during the recession was roughly only one third of the drop for the average company.
(Click to enlarge)
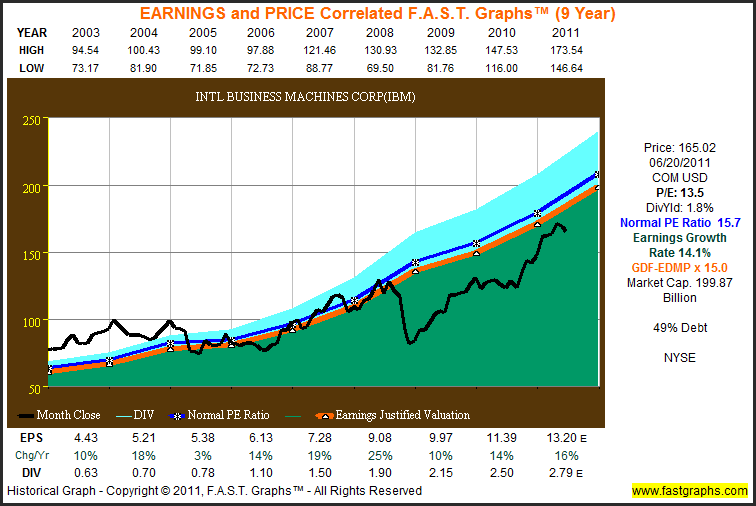
Intel Business Machines Corp. (IBM)
Our third example reviews IBM. Since calendar year 2003, IBM has consistently grown their earnings in excess of 14% per annum. Although IBM is not the fastest grower of our group, it has clearly been one of the most consistent. As a preview to what will come later in the article, this consistent record of earnings growth perhaps explains why they have the highest current valuation of our five examples.

(Click to enlarge)
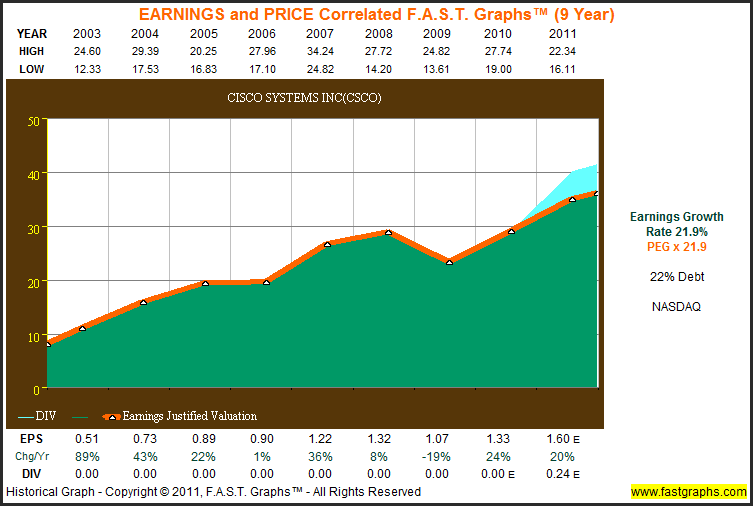
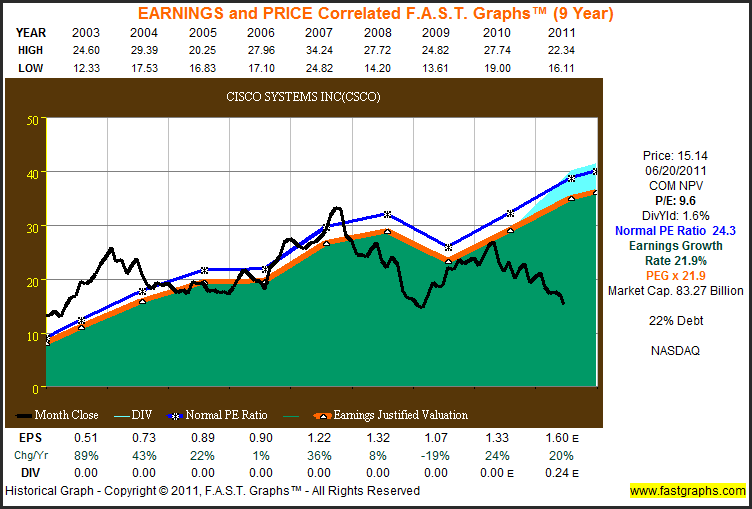
Cisco Systems Inc. (CSCO)
Our fourth example reviews Cisco Systems Inc. Since 2003, Cisco has grown earnings at just under 22% per annum with only one hiccup in fiscal year 2009. Note that Cisco Systems Inc. has declared their first dividend in March of 2011. Therefore, this once highflying growth stock is at the threshold of morphing into a growth and income selection.
(Click to enlarge)
Hewlett-Packard Co. (HPQ)
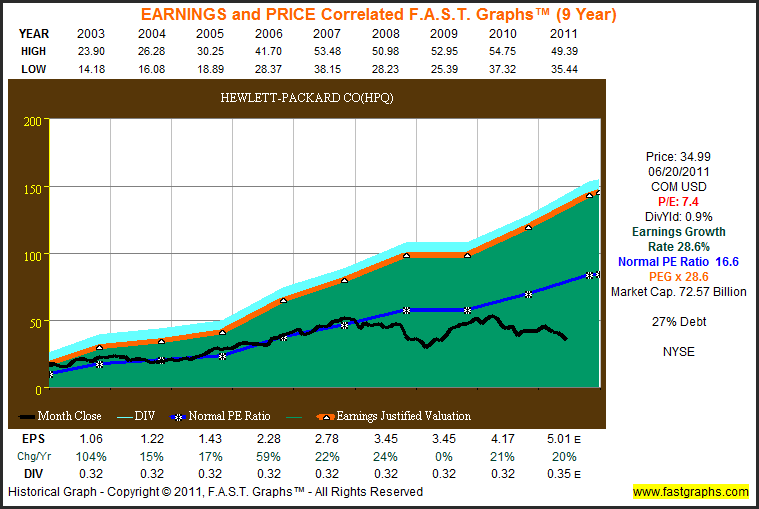
Our fifth and final example looks at Hewlett-Packard Co. There is an irony, that will become clear later in the article, with the fact that Hewlett-Packard has generated the fastest earnings growth rate of 28.6% since calendar year 2003. Although Hewlett-Packard does pay a dividend, more than likely due to its growth characteristics, they have paid the same $.32 per share since calendar year 2003. Nevertheless, Hewlett-Packard Co. represents an example of a significantly above-average publicly traded operating business.

(Click to enlarge)
Our Five Tech Giants versus the S&P 500
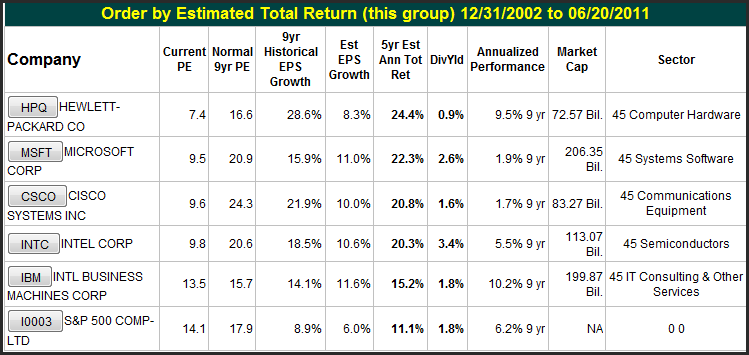
The following chart summarizes the current and historical valuation that has traditionally been applied to our five Tech Giant examples and the S&P 500. The first column after the company's name lists the current price earnings ratio for each example. Hewlett-Packard Co. with the highest historical earnings growth rate is currently being awarded the lowest price earnings ratio of 7.4. This is the irony referenced above.
In contrast, the S&P 500, which carries the lowest earnings per share growth rate, is currently being awarded the highest PE ratio of 14.1. Even more ironically, the S&P 500 with the highest current PE ratio, simultaneously has the lowest expected five-year earnings per share growth of 6% per annum (note the column labeled-Est EPS Growth). As we pointed out in the introduction of this article, this would not typically happen when evaluating a private business. In other words, there is often a peculiar illogic that this enigma, known as Wall Street, often applies to how it values a business.
(Click to enlarge)
Earnings and Price Correlated Graphs
In the following graphs we add important metrics that deal with and illustrate valuation. First and foremost, is the black line representing monthly closing stock prices over the timeframe calendar year 2003 to current time. The blue line with asterisks represents the calculated historical normal PE ratio for each example. With these important lines added to the graphs, we can determine how the market has historically valued or priced each example, and contrast it with how the market is pricing them today.
We will start with our benchmark S&P 500. It should be of special interest for the reader to note that the current price earnings ratio of 14.1 for the S&P 500 is the lowest it has been since calendar year 2003. In other words, the S&P 500, at least on a historical basis, appears to be modestly undervalued at today's levels. Nevertheless, as we already pointed out, the S&P 500 commands the highest PE ratio of our group. From the graph below, the strong long-term correlation between earnings and market price is clear. With lots of volatility in the short run, stock price follows earnings in the long run.
The S&P 500
(Click to enlarge)
Hewlett-Packard Co.
When you look at how the stock market is currently pricing Hewlett-Packard, you have to ask yourself why. The company has one of the most consistent and the highest record of earnings growth of the entire lot. The current PE ratio of 7.4, which is roughly half of the PE ratio awarded to the average company, makes no common business sense. Additionally, from the table above you can see that the consensus five-year earnings growth forecast of 8.3% for Hewlett-Packard is higher than the markets consensus forecast of 6%. This begs the question: How is a premier fast-growing technology company with a more consistent and much faster record of operating excellence, both historical and forecast than the average company, only worth half as much?
(Click to enlarge)
Microsoft Corp.
When reviewing the graph on Microsoft Corp. a couple of interesting points are revealed. First of all, we notice that the market has historically placed a premium valuation on this dominant software company. Consequently, Microsoft's poor stock price performance over the past decade is attributed to overvaluation, and not poor business results. Next, we discover that since the recession of 2008 earnings growth has re-accelerated. Fiscal year 2010 brought 29% earnings growth, and fiscal year 2011 is expected to bring another 21% earnings growth. Both of these numbers are higher than their 15.9% historical average since 2003. Yet inexplicably, Microsoft can be bought today at less than 10 times earnings with a 2.6% dividend yield and growing.
(Click to enlarge)
Cisco Systems Inc.
When reviewing the graph on Cisco Systems Inc., we find another example of a company with strong earnings growth and poor current stock price performance. Even during the recession of 2008, Cisco's operating earnings results were stronger than the average company. And, similar to what we saw with Microsoft, earnings have rebounded very strongly since the recession. Nevertheless, the market is currently valuing Cisco shares at less than 10 times earnings. A single-digit PE ratio for this high-quality technology stalwart with above-average past, and expected future earnings growth seems illogical. The initiation of their first dividend adds to this company's long-term appeal.
(Click to enlarge)
Intel Corp.
Intel Corp. is one of the most cyclical of the five technology stalwarts this article has reviewed. However, a 3.4% dividend yield coupled with the legacy of increasing their dividend seems to warrant a higher price earnings ratio than 9.6. Therefore, it seems odd that this stock is trading at one of its lowest valuations ever.

(Click to enlarge)
International Business Machines Corp.
IBM has generated the most consistent above-average earnings growth of the group. It is interesting to note that IBM’s stock price fell along with the general market during the recession of 2008, even though their operating earnings remained strong. Therefore, it's only logical that their stock price has been recovering ever since, as it steadily climbs back to its intrinsic value (the orange line). On the other hand, the fact that this extremely high quality company still trades at a below market PE ratio doesn't compute.
(Click to enlarge)
Conclusions
These five industry dominant, blue chip, leading technology stalwarts represent prima facie evidence of how absurd and irrational the stock market can be at times. The facts are that the fundamentals underpinning each of these strong and healthy technology giants are significantly better than average. Therefore, logic would dictate that the shares of these companies’ stocks should command a premium valuation relative to the average company or the S&P 500. It makes no rational or business sense that they don't.
There are many who will express opinions about how any or all of these companies are being mismanaged or how they are out of step with modern times, etc. Yet, each of these companies have continued to generate strong above-average business results over the past 10 or so years. Even more importantly, the consensus of leading analysts is that each of these companies are expected to continue to grow at above-average rates for at least the next 3 to 5 years.
But perhaps the most important point this article is attempting to make, is that even if these companies’ earnings growth ends up being half of what is expected, or doesn't grow at all, these blue-chip technology stocks should still command an average market PE ratio. The fact that all of them trade at below-market PEs, and the majority at single-digit PEs, indicates extreme undervaluation, in our opinion. The following Warren Buffett quote summarizes our view:
"The fact that people will be full of greed, fear or folly is predictable. The sequence is not predictable." Warren Buffett
As always, we recommend that each investor conduct their own due diligence. However, if there ever were a group of better businesses trading at lower valuations, it would be news to us. Therefore, conservative investors, or investors looking to retire that are seeking growth and income should find this list an opportunistic place to start. Great companies at great valuations don’t come along every day.
Disclaimer: The opinions in this document are for informational and educational purposes only and should not be construed as a recommendation to buy or sell the stocks mentioned or to solicit transactions or clients. Past performance of the companies discussed may not continue and the companies may not achieve the earnings growth as predicted. The information in this document is believed to be accurate, but under no circumstances should a person act upon the information contained within. We do not recommend that anyone act upon any investment information without first consulting an investment advisor as to the suitability of such investments for his specific situation.
Disclosure: I am long INTC, MSFT, CSCO, HPQ.
Wikio
No comments:
Post a Comment