Introduction
The opportunity to invest in a great business on sale is the holy grail of the value investor. Unfortunately, it is a rare occasion when one is actually able to invest in a great business at a price that is below its intrinsic value. But even more unfortunate, is the penchant investors have of being afraid to lay their money down when these rare opportunities do occur.
There's a terrific article by Seeking Alpha author Jeff Miller that speaks to what it takes to be a successful investor, even in this environment (link here). In his article Jeff provides several pearls of investing wisdom. I would like to offer a summary of Jeff's excellent article with one of my favorite Warren Buffett quotes as follows:
To invest successfully over a lifetime does not require a stratospheric IQ, unusual business insight, or inside information. What's needed is a sound intellectual framework for decisions and the ability to keep emotions from corroding that framework.
As Jeff Miller also pointed out in his article:
Beware of the news. The news is always about problems and potential disasters. Some of it comes from those profiting from your fear. Widely publicized worries are reflected in market prices. It is the unexpected --the true black swan -- that requires attention.
Five Leading Retailers with Dirt Cheap PE’s
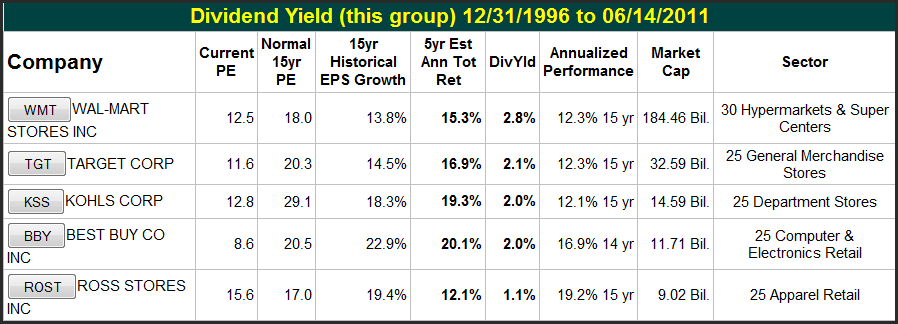
The following portfolio review lists five retailers that pay a nice dividend and whose stocks are currently trading at a discount to historical norms. The first two columns following the company's name represent the focal point of this review. Each of these five companies is currently priced at a bargain PE ratio that is below its normal 15-year PE ratio. In some cases the discount to their historical norms is significant, even though their businesses remain strong. These five retailers are known for offering shoppers bargain prices on their merchandise. Therefore, as we will soon illustrate, their businesses remained strong and healthy right through the last two recessions of 2001 and 2008.
click on all charts to enlarge
A Picture is Worth 1000 Words
We developed our fundamentals analyzer software tool, F.A.S.T. Graphs™, for the specific purpose of providing investors a sound intellectual framework for making investing decisions based on fundamental values. The following analysis provides three graphs on each company.
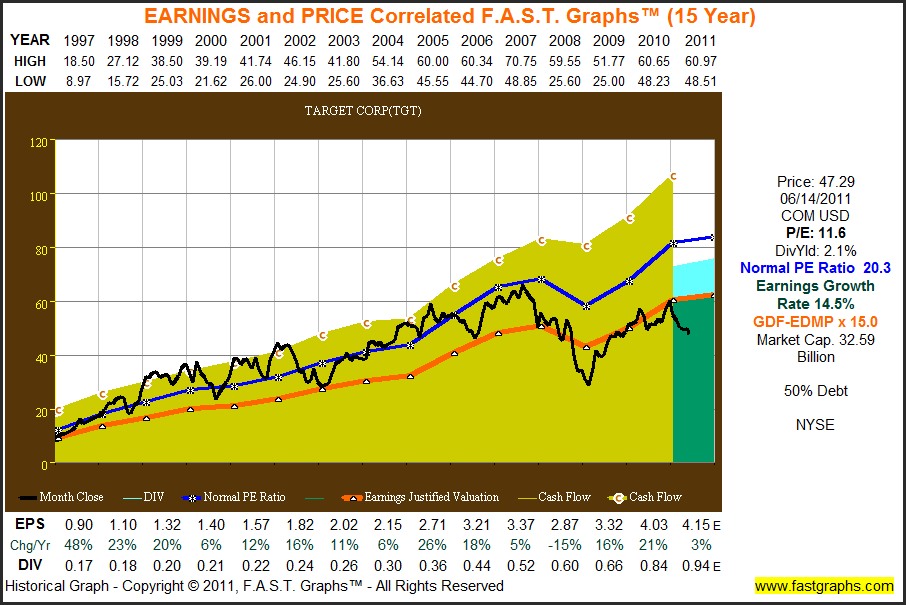
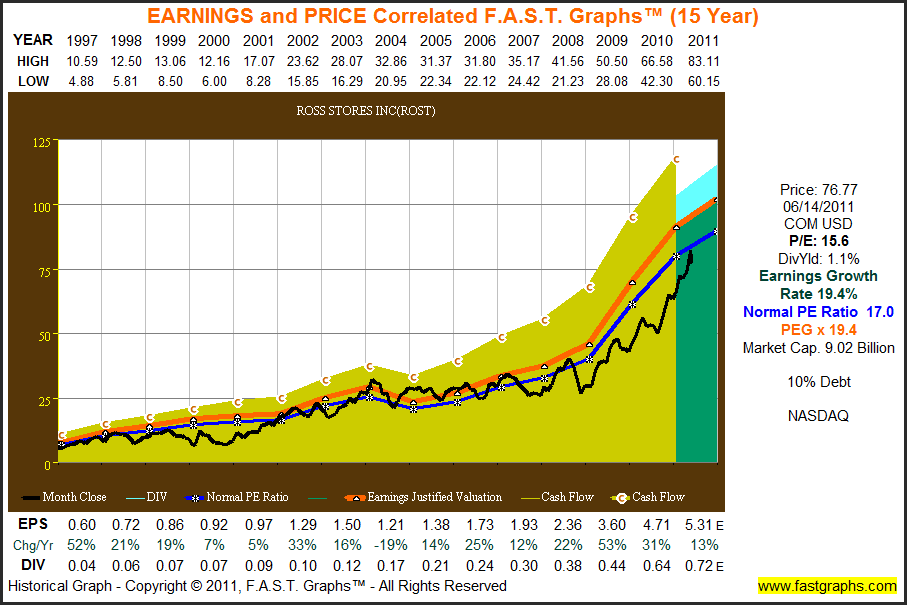
First, is a historical 15-year earnings and price correlated graph with an additional cash flow overlay (mustard green shaded area marked with a “c”). It's important to note that each of our five examples generate cash flow per share that is higher than earnings-per-share. The orange line represents the earnings justified valuation line, and the blue line represents a calculated historical normal PE ratio.
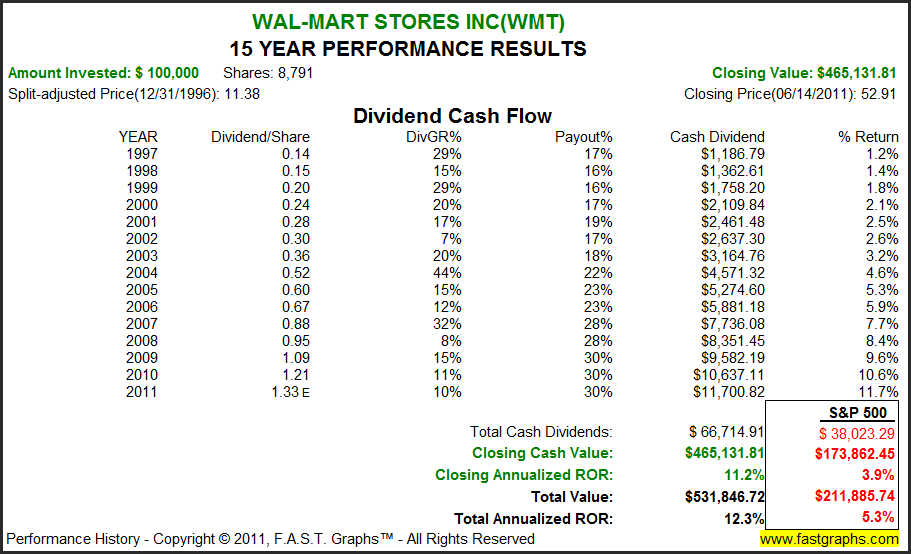
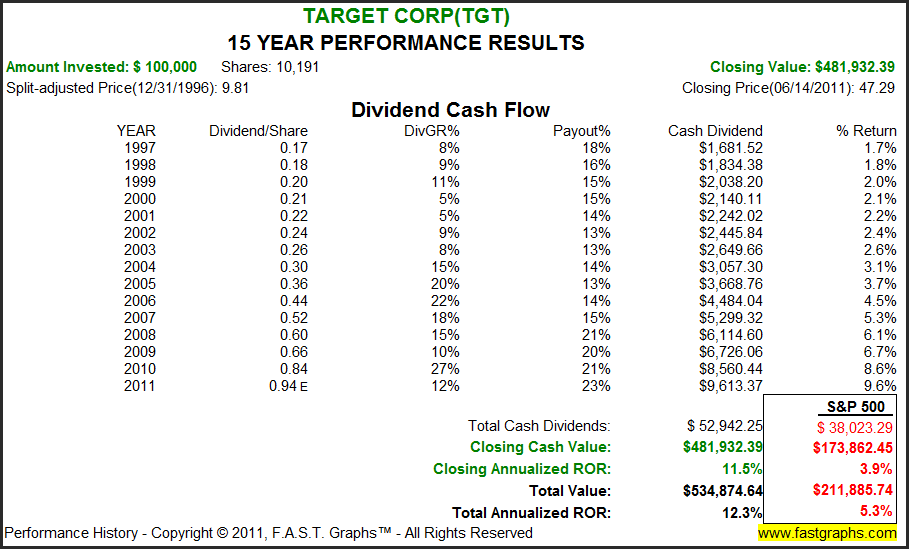
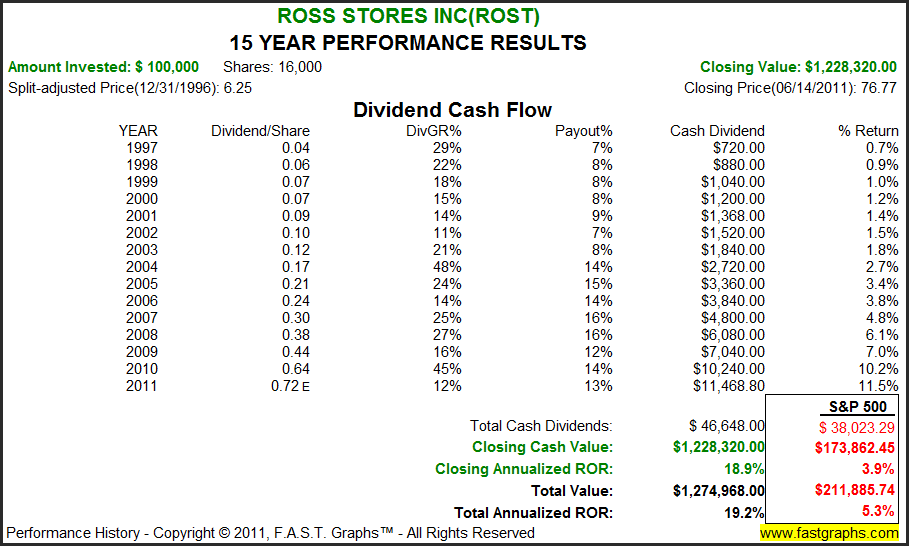
Second, is the associated performance graph to include the company's dividend cash flow table. Notice how each of these companies have rewarded shareholders far in advance of the S&P 500, or the average company.
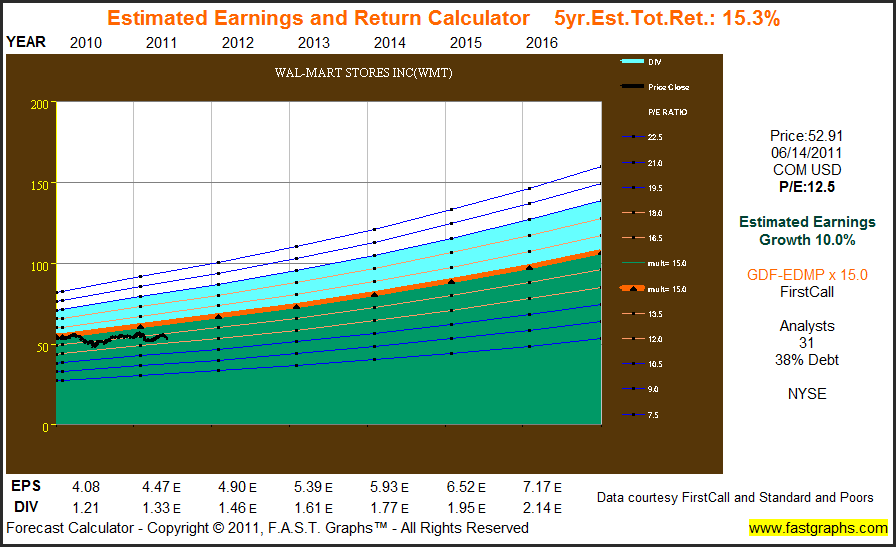
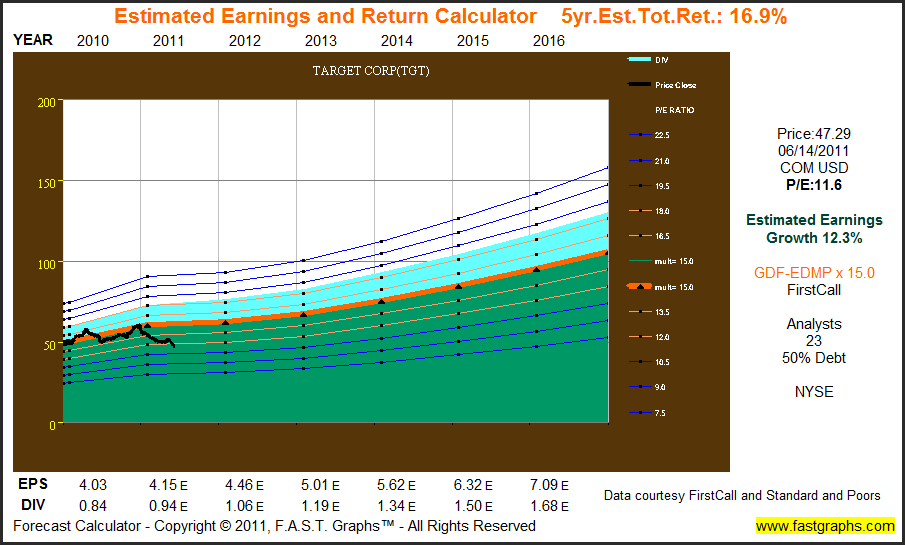
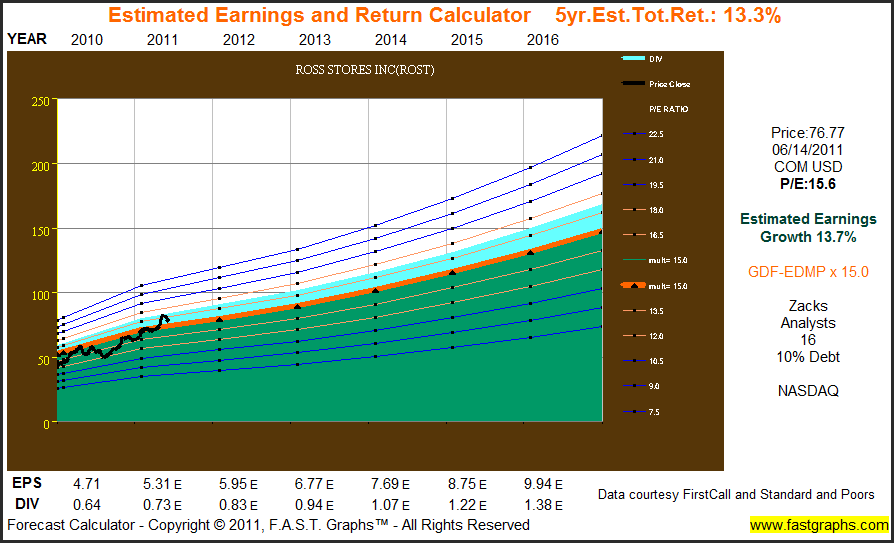
Third, is the estimated earnings and return calculator based on the consensus five-year earnings estimates reported to FirstCall by leading analysts following each company. The five-year estimated total return figure for each company assumes that they achieve the forecast earnings growth and that the market capitalizes that growth at a historically normal PE ratio of 15.
Although we will let the graphs speak for themselves, the occasional comment will be included for clarity.
Wal-Mart Stores Inc. (WMT)
The real story behind the Wal-Mart (WMT) historical graph is how overvalued the stock became by year-end 1999, causing the stock price to essentially move sideways, or flat, for more than a decade. Here we see a great company whose business continued to prosper and grow while its stock price floundered and was range-bound due to excessive overvaluation.
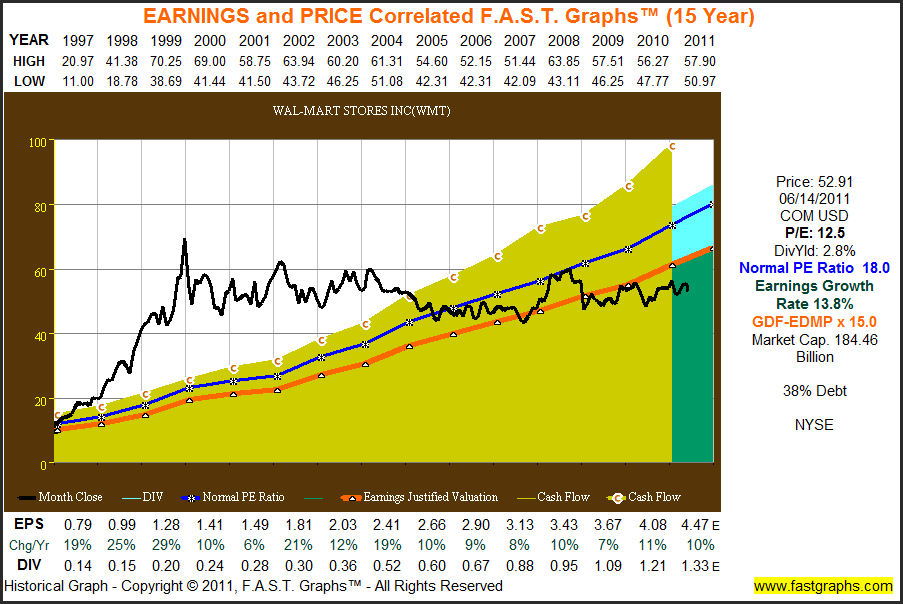
However, even while Wal-Mart’s stock price flatlined, their dividend continued to rapidly increase in correlation to strong earnings growth. This is a very attractive attribute for the prudent long-term dividend growth investor. It's also interesting to note that Wal-Mart's payout ratio also increased since 1997.
The consensus five-year estimated earnings growth rate of 10% would indicate that Wal-Mart is an attractive buy at today's historically low PE ratio.
Target Corp. (TGT)
Although Target’s earnings-per-share did slightly weaken during the recession of 2008, their stock price reaction was excessive. However, even though earnings have recovered, Target Corp.'s stock price remains significantly below its historical normal valuation (blue line).
Target Corp. (TGT), thanks to an attractive beginning valuation, coupled with an above-average earnings growth rate of 14%, was able to reward shareholders far in advance of the S&P 500. Their dividend growth was also above average.
The consensus five-year estimated earnings growth rate of 12.3% indicates that Target Corp. is undervalued with a current PE ratio of only 11.6.
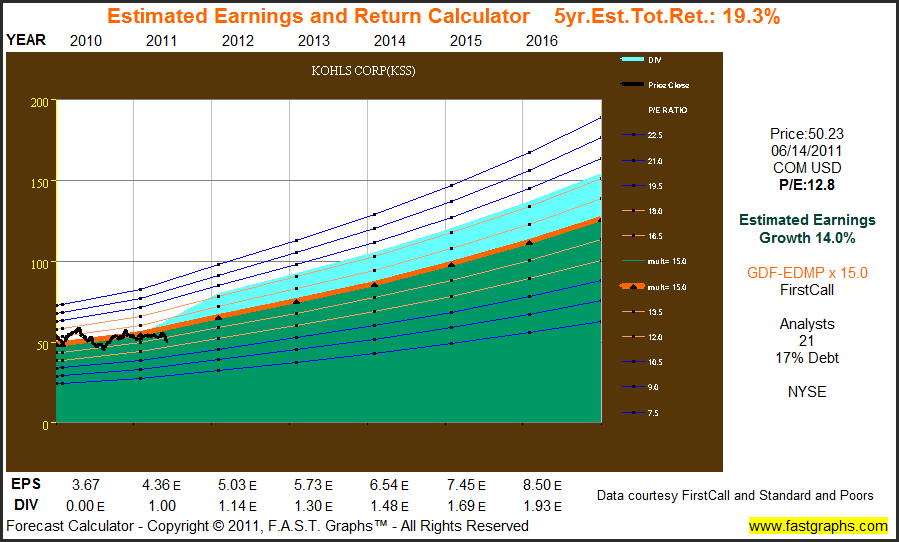
Kohls Corp. (KSS)
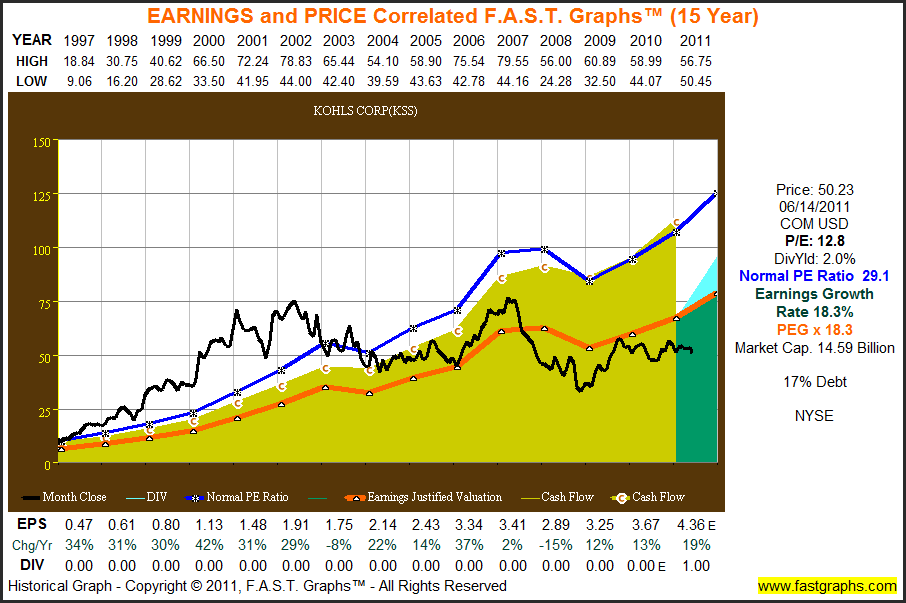
Due to Kohls Corp.'s exceptionally high historical earnings growth rate in excess of 18%, the stock market had traditionally priced this excellent retailer at a premium. When earnings slightly faltered during the recession of 2008, the excessive valuation was wrung out of the stock as the price is now below the orange earnings justified valuation line.
Kohl's Corp. (KSS) has just instituted their first dividend in 2011, however, the 2% rate is higher than the S&P 500. Also, even though the stock is currently trading at one of its lowest historical valuations, Kohl’s Corp. shareholders were rewarded far in excess of the S&P 500 since year-end 1996.
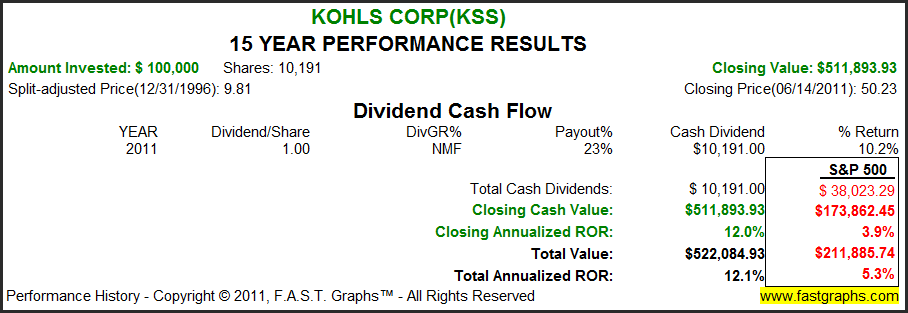
The consensus five-year estimated earnings growth rate of 14% is the highest of this group of five. Therefore, we believe the long-term opportunity for increasing dividends and above-average capital appreciation is possible.
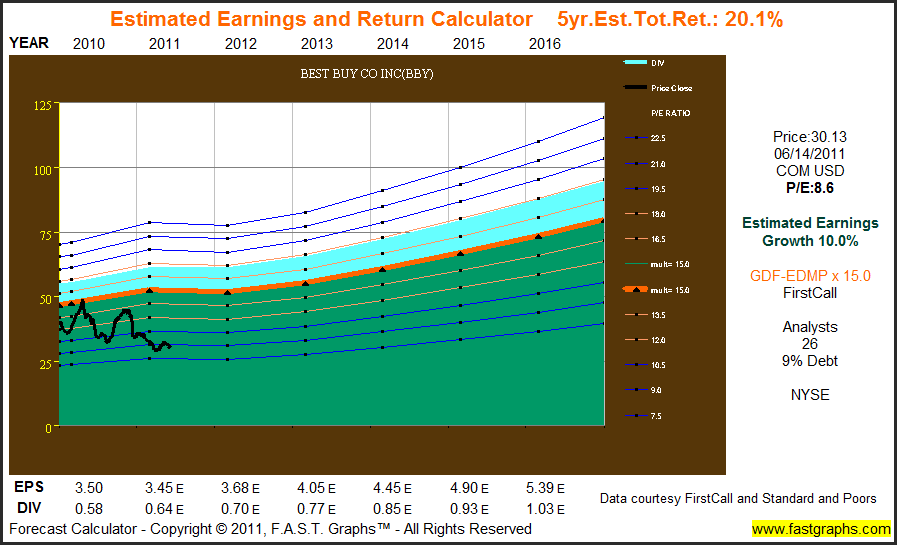
Best Buy Co. Inc. (BBY)
Best Buy Co. Inc. (BBY) is a company that many investors seem to love to hate. Based on recent price action, you would think that the company is bleeding red ink and on the verge of going out of business. However, their cash flow generation remains very high, and even though earnings have weakened a little recently, Best Buy remains a very profitable enterprise. For a more comprehensive review on Best Buy Co. Inc., followthis link to a recent Seeking Alpha editor's pick article by Geoffrey Rocca.
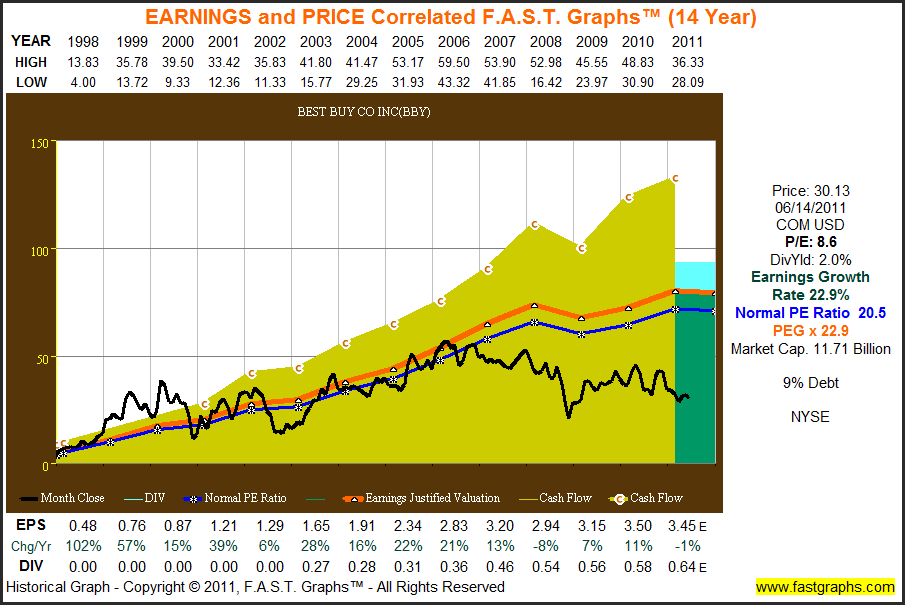
Even at today's dirt cheap PE ratio of 8.6, Best Buy Co. Inc. has rewarded shareholders far in excess of the S&P 500. Furthermore, after instituting their first dividend in calendar year 2003, they have steadily increased it in correlation to their earnings growth.
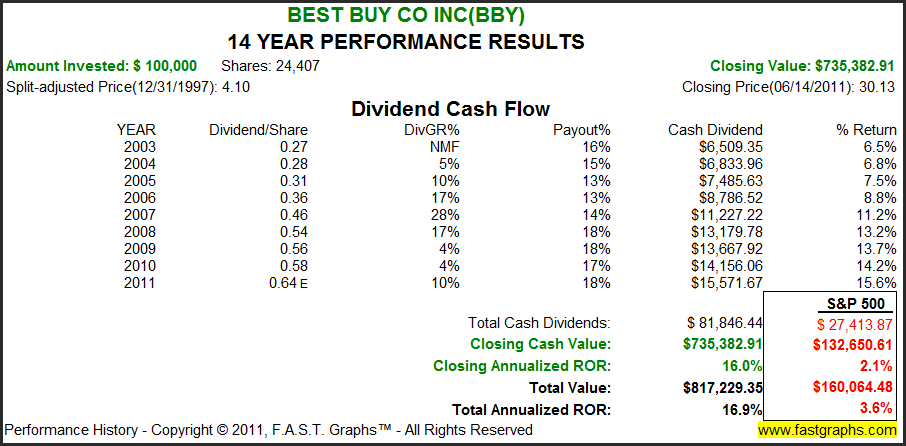
Even though Best Buy Co. Inc.'s forecast earnings growth rate of 10% is near average for this group, their 8.6 PE ratio is the lowest. Therefore, the five-year estimated total return of 20.1% per annum is the highest. Of course, this assumes that they meet those consensus earnings estimates and that the market prices them out of normal PE ratio of 15.
Ross Stores Inc. (ROST)
Ross Stores Inc. (ROST) is a fast-growing retailer whose stock price has more consistently followed their earnings than any of our other four examples. The company's cash flow per share is consistently greater than earnings-per-share and have actually accelerated since the great recession of 2008. Consequently, Ross Stores’ PE ratio of 15.6 is the highest of the group, modestly higher than the S&P 500, but still below its historical normal PE of 17.
Ross Stores Inc. has rewarded shareholders far in excess of the S&P 500. Their dividend growth rate has been extraordinary, and their payout ratio has steadily increased since 1997.
The estimated earnings and return calculator for Ross Stores is based on the consensus five-year earnings forecast of 16 analysts reporting to Zacks. Although their current price earnings ratio of 15.6 is below their historical norm of 17, Ross Stores Inc. appears to be fairly, to only slightly undervalued, at these levels.
Conclusions
We are fervent believers of the fact that in the long run-Earningsdetermine market price. Indeed, our F.A.S.T. Graphs™ research tool has provided a ponderous amount of undeniable evidence backing this up. It is only logical that the better a company performs as a business, the better a long-term investment it is. True value to investor shareholders, is obviously a function of the size of and velocity of the earnings and cash flow that the company produces. This is a pragmatic principle that can be trusted; all it requires is what we like to call “intelligent patience.”
The reason that intelligent patience is required, is because there exists an evil twin sister principle that states, in the short run-Emotionsdetermine market price. Consequently, the intelligent investor understands that there will be times when markets, based on either fear or greed, can dramatically misprice a company’s stock.
It is during the emotional times when fear dominates, like it does today, that true opportunity manifests. Great companies go on sale; thereby, the risk of owning them is reduced, while simultaneously the reward from owning them is increased. The possibility for higher returns at lower levels of risk is very intelligent investment behavior.
It is during the emotional times when fear dominates, like it does today, that true opportunity manifests. Great companies go on sale; thereby, the risk of owning them is reduced, while simultaneously the reward from owning them is increased. The possibility for higher returns at lower levels of risk is very intelligent investment behavior.
We believe that the five retailers reviewed in this article are representative of great businesses on sale. Furthermore, we believe that the fundamental-driven graphs presented clearly validate our view. The strong fundamentals underpinning each of these examples are much better than their current stock prices indicate. These companies have very strong balance sheets, produce great cash flows and each is poised to continue to grow at above industry rates far into the future.
As always, we recommend that each investor prepare their own individual due diligence. On the other hand, these retailers appear to be potentially very profitable candidates worthy of the effort.
No comments:
Post a Comment