Submit an
article to

article to
As the baby boomer generation approaches their retirement years, their thirst for income-producing investments is extremely high. Finding quality investments that produce enough income to meet their retirement needs is a challenge. Fixed income investments, historically an important component of a balanced investment portfolio, are producing disappointing and even inadequate yields. Couple this with the reality that a fixed income yield doesn't increase, and the prospects for a comfortable retirement appear dim.
Dividend paying common stocks with yields greater than the 4.54% that 30 year Treasury bonds are paying are available. Better yet, many can be found amongst the Dividend Champions, a list of 98 companies that have distinguished themselves by raising their dividends for 25 (or longer) straight years. In fact, the average number of years that the 98 Dividend Champions have increased their dividends without interruption is over 38 years (38.7). The complete 2010 list of Dividend Champions can be foundhere courtesy of David Fish.
At first glance this seems very enticing; investment selections from a distinguished group of high yield companies that have increased their dividend every year for 25 straight years. Remarkably, not only can you expect to earn a higher yield than you can get from long-term Treasury bonds, you also get the added benefit of your income potentially increasing every year. Statistically speaking, common stocks with these attributes do, in truth and reality, exist. Therefore, it seemed only logical to compile a group of these distinguished dividend payers from which to build a rising dividend income portfolio.
Therefore, utilizing our F.A.S.T. Graphs research tool, we took the David Fish Dividend Champions list of 98 companies and sorted them by dividend yield highest to lowest. Interestingly, there are 14 out of 98 companies on David's list that currently yield higher than a 30 year Treasury bond (4.54%). Statistically, thanks to David's excellent list, we know that each of these companies has raised their dividend for at least 25 consecutive years. However, we really don't know how fast each company has increased their dividend, nor do we have a clear picture of each company's fundamental operating history and track record.
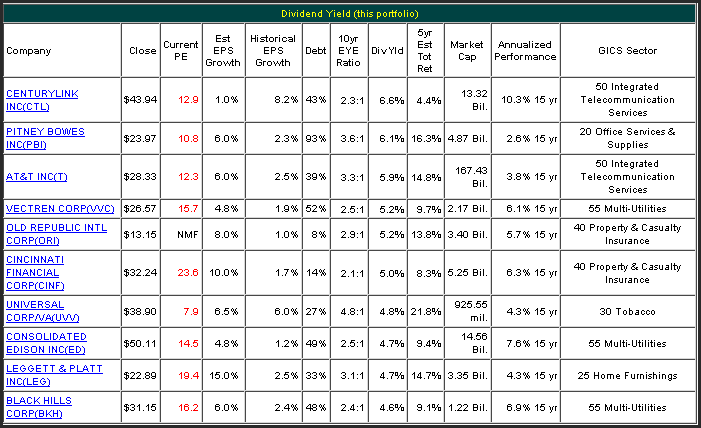
So even though statistical analysis is helpful, it is no substitute for a more thorough research analysis. This is where our graphs' "fundamentals at a glance" research tool comes into play. With this powerful tool at our disposal, we can drill down deeper into the fundamentals and determine whether a more thorough research effort is warranted or not. This can save a lot of potential wasted time and effort. The following graphs portfolio review summarizes the top 10 highest yielding Dividend Champions from both a historical perspective and a consensus future earnings estimate basis (Note: this list excludes REITs which will be covered separately in a separate article).
10 highest yielding (non REIT) Dividend Champions: Summary EPS Estimates and Historical Review
(Click to enlarge)
Drilling deeper with graphs
The following analysis will review each of the 10 highest yielding Dividend Champions through the lens of our graphs research tool. We will review each company's historical operating results (earnings growth and dividends) since calendar year 1997 and include the current consensus forecast for 2011. A brief commentary will be offered on each of the graphs and associated historical performance chart in order to assist the reader in interpreting the data presented.
This exercise will include comments on current valuation based on consensus estimates. However, we offer no opinion regarding whether the reader should or should not invest in any of the selections. We will leave this important decision to each reader’s own investment objectives and risk tolerances. The primary objective of this exercise is to illustrate the dangers of relying on statistical analysis alone. The old adage that "statistics don't lie, statisticians do" seems appropriate. Our secondary objective is to assist the reader in determining whether or not a more extensive research effort on each company is warranted.
CenturyLink Inc. (CTL)
About CenturyLink
CenturyLink is a leading provider of high-quality broadband, entertainment and voice services over its advanced communications networks to consumers and businesses in 33 states. CenturyLink, headquartered in Monroe, La., is an S&P 500 company and is included among the Fortune 500 list of America’s largest corporations.
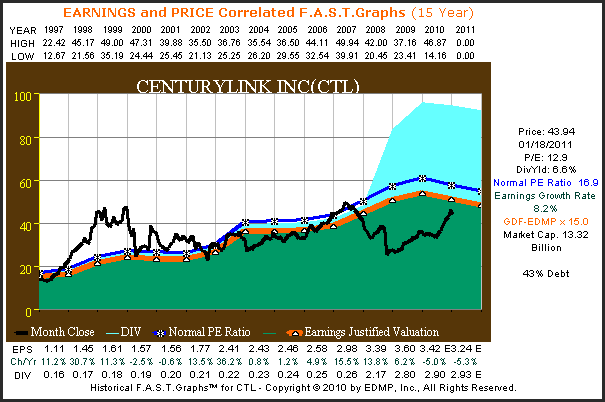
Once a primarily rural focused telephone company, CenturyLink has morphed into the fourth largest telephone company in the United States. Prior to calendar year 2008, this well-managed company was more of a moderate growth and income story. But as the phone industry changed, the formerly CenturyTel morphed into today’s CenturyLink. From the graph below it's clear that their dividend policy also changed dramatically in 2008. Furthermore, so have their earnings growth prospects. Current consensus earnings estimates project a dramatic long-term slowing of earnings growth.
(Click to enlarge)
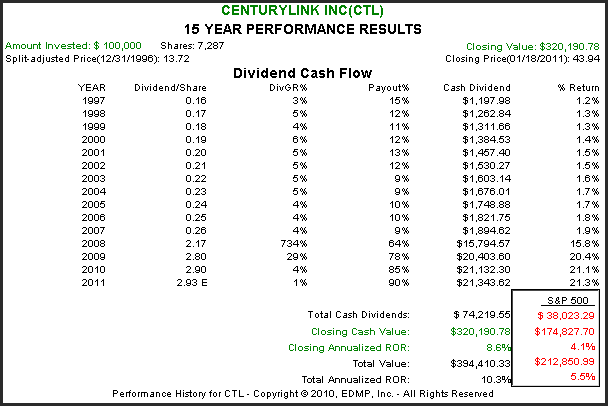
From the calculated performance results associated with the above earnings and price correlated graph, the dramatic change in this company and its attitude towards shareholders is vivid. In calendar year 2008 their payout ratio increased from low double-digit rates that grew on average by 5% or so, into a high payout ratio, and therefore, higher-yielding company. Consequently, prospective investors in CenturyLink need to focus much more on the future while ignoring the past. Going forward this is clearly a new company with attributes markedly different than it possessed in the past.
(Click to enlarge)
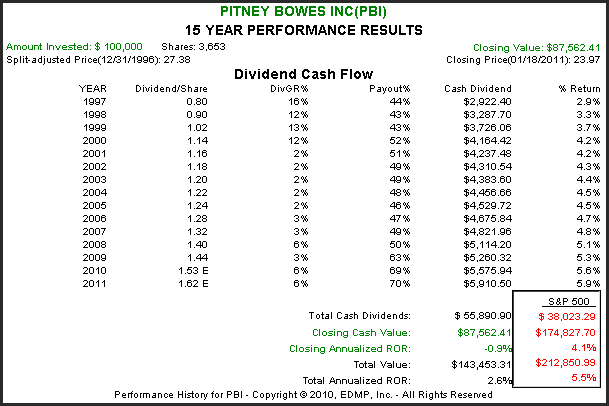
Pitney Bowes Inc. (PBI)
About Pitney Bowes Inc.
Celebrating its 90th year of innovation, Pitney Bowes creates, sells and services hardware, software, and solutions that help its customers integrate physical and digital communications channels. Founded in 1920, Pitney Bowes had 2009 revenues of $5.6 billion and 33,000 employees.
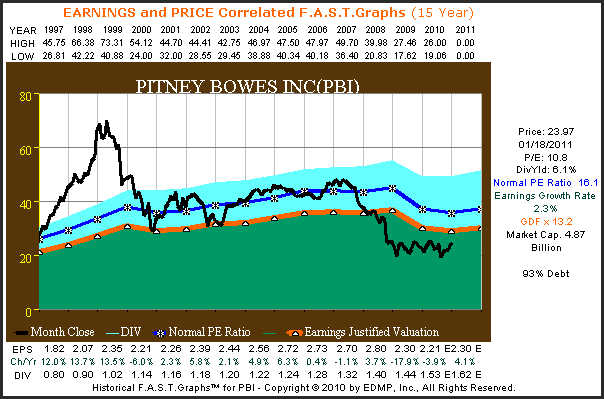
Pitney Bowes, the second highest yielding Dividend Champion on our top 10 highest yielding list, is also a company that has experienced great change. However, thanks to a major restructuring effort, the consensus of leading analysts following the company expects future earnings growth to resume the 6% or greater level. Consequently, today's low valuation and high yield in excess of 6% may be worthy of further investigation.
(Click to enlarge)
Once considered a steady-eddy, Pitney Bowes has experienced earnings pressure in recent years. This reduction in earnings has led to a significant drop in their stock value and the normal valuation that the market has placed on their shares. Consequently, long-term shareholders have suffered a loss of principal value, but thanks to their steadily rising dividend they were able to eke out a modest return since 1997.
(Click to enlarge)
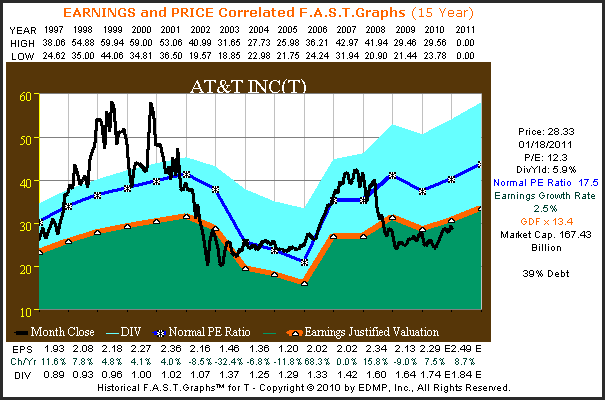
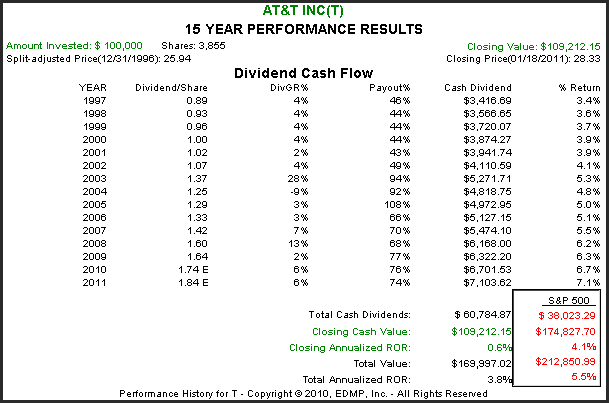
AT&T Inc. (T)
About AT&T
AT&T Inc. is a premier communications holding company. Its subsidiaries and affiliates – AT&T operating companies – are the providers of AT&T services in the United States and around the world. With a powerful array of network resources that includes the nation's fastest mobile broadband network, AT&T is a leading provider of wireless, Wi-Fi, high speed Internet and voice services. A leader in mobile broadband, AT&T also offers the best wireless coverage worldwide, offering the most wireless phones that work in the most countries.
AT&T is another telephone company that has been affected by the tremendous change in telecommunications brought about by the explosion of wireless. Similar to CenturyLink above, AT&T has been forced to evolve their business model. From the earnings and price correlated graph below, it's clear that earnings growth has been somewhat cyclical since 1997. Recent earnings growth has improved thanks in large part to an exclusive contract with the highly popular iPhone. Recent concerns about their loss of exclusivity with Apple (APPL) have brought the stock into a historically low level of valuation, and therefore, a higher than normal current yield.
(Click to enlarge)
The calculated performance chart below shows that AT&T was only able to maintain shareholder principal since 1997. However, strong and steady dividends lead to a modest total return. Note that they paid a one-time dividend of $.25 in calendar year 2003 which creates the illusion that their dividend was cut in 2004. In truth, their normal dividend increased from $1.07 in 2002 to $1.12 in 2003. Therefore, the $1.25 reported in 2004 represented an increase over 2003.
(Click to enlarge)
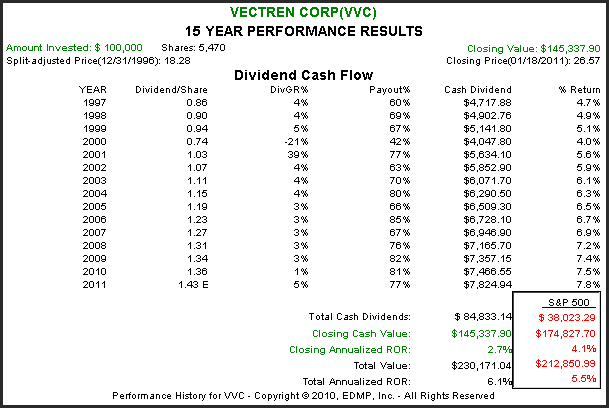
Vectren Corp. (VVC)
About Vectren Corporation
Vectren Corporation is an energy holding company headquartered in Evansville, Indiana. Vectren's energy delivery subsidiaries provide gas and/or electricity to over one million customers in adjoining service territories that cover nearly two-thirds of Indiana and west central Ohio. Vectren's non-utility subsidiaries and affiliates currently offer energy-related products and services to customers throughout the Midwest and Southeast. These include gas marketing and related services; coal production and sales; and energy infrastructure services.
The earnings and price correlated graph on Vectren Corp. illustrates a company with a history of very erratic earnings growth. Currently the company trades at a historical normal PE ratio. However, from the graphbelow, it's evident that this company is purely a dividend story.

The calculated performance chart below tells the story of a company that has primarily relied on dividends to reward their shareholders. Although their growth in earnings has been modest, they have consistently increased their dividend at a steady but modest rate year after year.
(Click to enlarge)
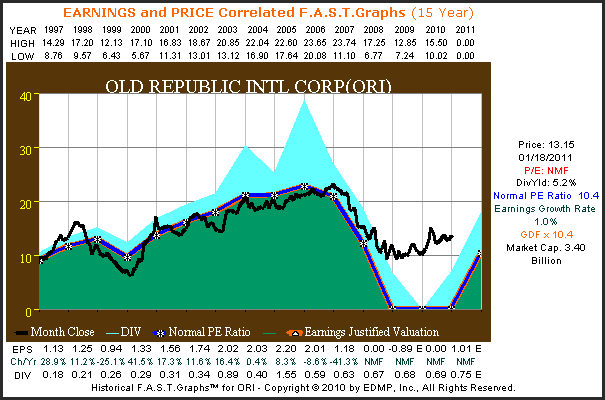
Old Republic International Corp. (ORI)
About Old Republic International Corp.
Old Republic International Corporation is among the nation's 50 largest publicly-held insurance organizations, with a substantial interest in major segments of the industry. The company is primarily a commercial lines underwriter, serving many of America's leading industrial and financial services companies as valued customers.
Like many of its peers, Old Republic International Corp. suffered extreme business issues during the great recession. Unfortunately for shareholders, even though the company suffered earnings losses, strong operating cash flows allow them to maintain and increase their dividend. The current consensus forecast for future earnings growth is estimated at about 8% per annum over the next five years. This potential recovery could be of interest to the more venturesome investor.
(Click to enlarge)
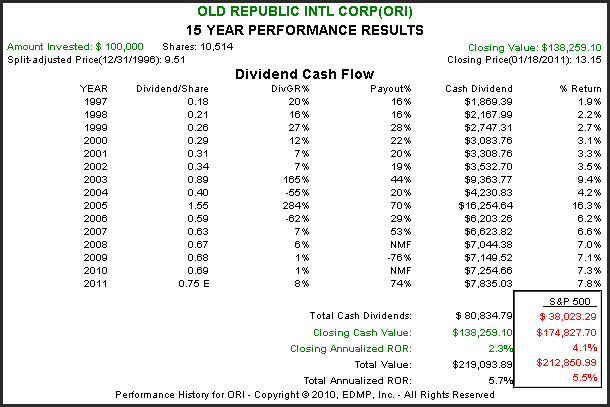
Even though Old Republic International experienced significant fundamental deterioration along with most financials during the great recession, they stayed committed to their dividend. Although their dividend was technically increased in 2008 through 2010, the increase was clearly significantly below historical patterns. The apparent large dividend increases and subsequent dividend cuts from 2003 through 2006 were once again the result of a special dividend of approximately $.53 in 2003, and a $.80 special dividend in 2005.
(Click to enlarge)
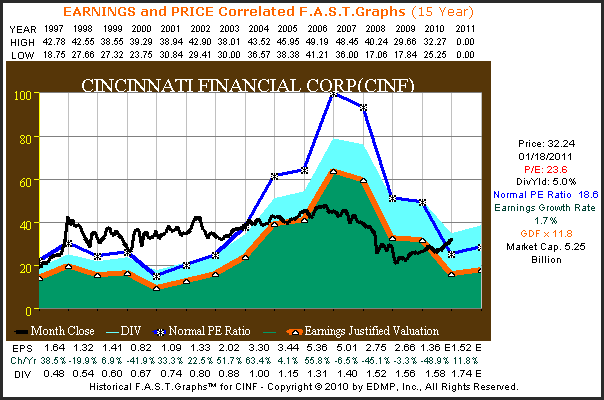
Cincinnati Financial Corp. (CINF)
About Cincinnati Financial Corp.
Cincinnati Financial Corporation is engaged in property casualty insurance marketed through independent insurance agents in 37 states. The company operates in four segments: Commercial lines property casualty insurance, Personal lines property casualty insurance, Life insurance and Investments. During the year ended December 31, 2009, the company owned 100% of three subsidiaries: The Cincinnati Insurance Company, CSU Producer Resources Inc. and CFC Investment Company. Its standard market property casualty insurance group includes two subsidiaries: The Cincinnati Casualty Company and The Cincinnati Indemnity Company. This group writes a range of business, homeowner and auto policies.
Cincinnati Financial Corp. is another example of a financial company that suffered during the great recession. Although they remained profitable, their earnings fell precipitously from their peak in 2006 to their apparent bottoming in 2010. Once again, decent operating cash flows throughout this period allowed them to maintain their unblemished record of increasing their dividend. Note that their current valuation is very high relative to current earnings. Even though consensus earnings estimates look for a 10% growth rate, we would caution that the current valuation is nevertheless high.
(Click to enlarge)
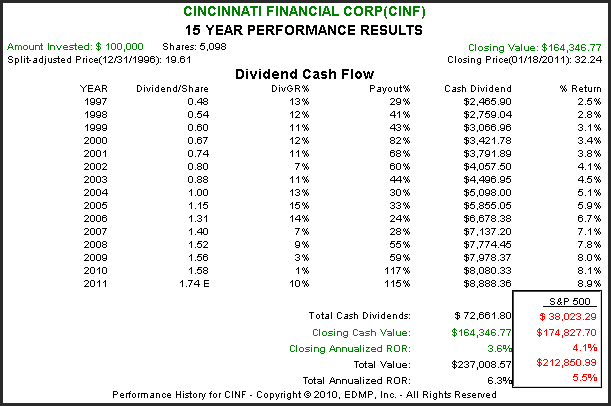
This company’s earnings record above and historically high valuation should be an area of concern. Even though this company remains technically a Dividend Champion, its spotty earnings record needs to be given careful consideration. All in all, however, this company has rewarded shareholders reasonably well with a combination of dividend income and modest capital appreciation since 1997.
(Click to enlarge)
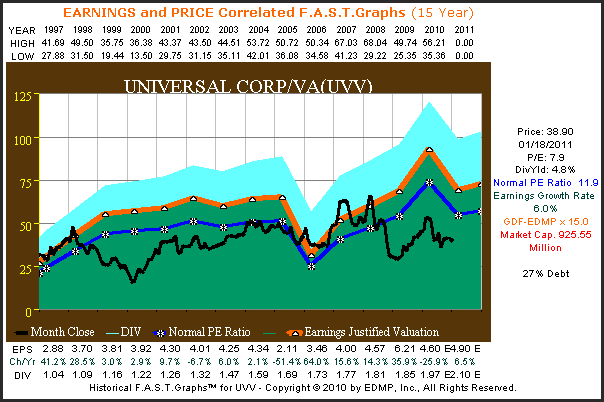
Universal Corp./VA (UVV)
About Universal Corp./VA
Universal Corporation headquartered in Richmond, Va., was founded in 1918. Universal, through its subsidiaries and affiliates, is the world's leading leaf tobacco merchant and processor. The largest portion of the company's business involves the procurement, processing, packing, and supply of flue-cured and burley tobacco to manufacturers of consumer tobacco products. Universal does not manufacture cigarettes or other consumer products. Most of the company's revenues are derived from sales of processed tobacco and from fees and commissions for specific services. Universal conducts its business in more than 30 countries and employs over 24,000 permanent and seasonal workers.
The earnings and price correlated graph on Universal Corp./VA depicts another example of a company with a less than a perfectly predictable historical earnings record. Even though earnings growth has averaged 6% per annum; growth has been far from steady. The current single-digit PE ratio gives this holding some allure; however, the tobacco industry is not highly regarded by many investors today.
(Click to enlarge)
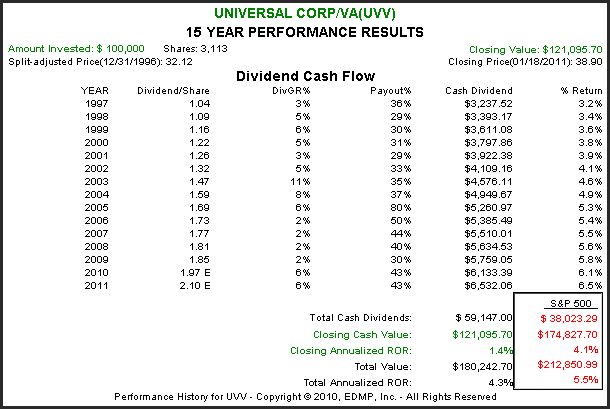
From the performance calculations below, it is evident that Universal Corp.'s dividend growth rate has been less than consistent. On the other hand, they have produced an increase every year. But once again, we find that total return for this high-yielding Dividend Champion to be modest, and slightly below average.
(Click to enlarge)
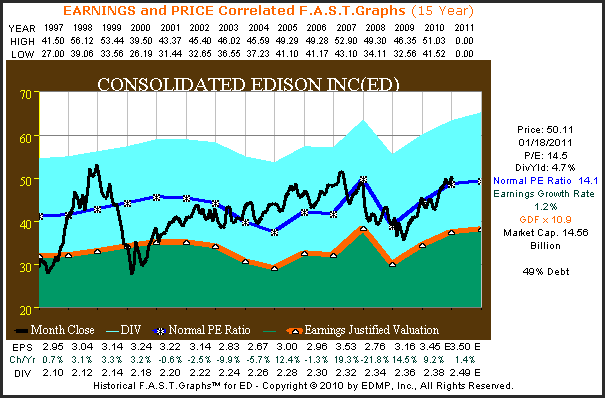
Consolidated Edison Inc. (ED)
About Consolidated Edison Inc.
Consolidated Edison, Inc. is the holding company of Consolidated Edison Company of New York, Inc. (CECONY), and Orange and Rockland Utilities, Inc. (O&R). CECONY’s business operations are its regulated electric, gas and steam delivery businesses. O&R’s principal business operations are its regulated electric and gas delivery businesses. Its competitive energy businesses sell electricity to wholesale and retail customers, provide certain energy-related services and participate in energy infrastructure projects. CECONY provides electric service to approximately 3.3 million customers in all of New York City (except part of Queens) and Westchester County, an approximately 660 square mile service area with a population of more than nine million. O&R and its utility subsidiaries, Rockland Electric Company (RECO) and Pike County Power & Light Company (Pike) provide electric service to approximately 0.3 million customers.
The earnings and price correlated graph on Consolidated Edison draws a consistent but low growth earnings picture that is typical of regulated utilities. However, thanks to their attractive dividend yield, the company is currently trading at a historically normal valuation.
(Click to enlarge)
The calculated performance chart below shows that lower earnings growth also leads to low dividend increases. Consolidated Edison does qualify as a Dividend Champion, but their growth yield is far from spectacular. Decent yield and low growth is very typical performance for utility stocks.

(Click to enlarge)
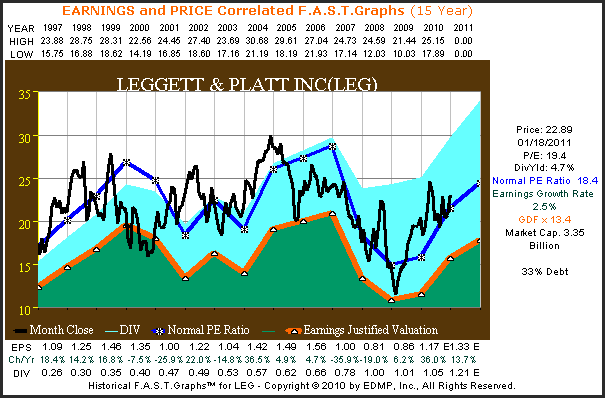
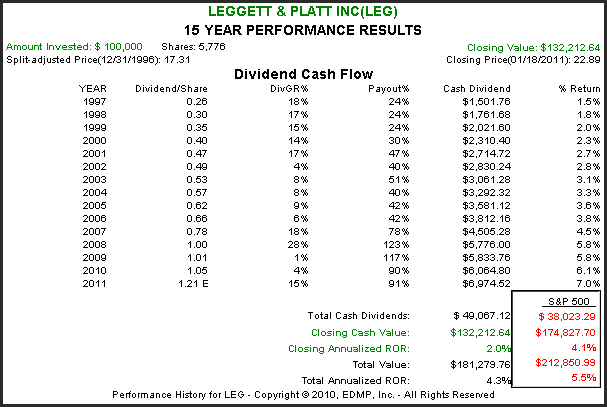
Leggett and Platt Inc. (LEG)
About Leggett and Platt
Leggett & Platt is a diversified manufacturer that conceives designs and produces a broad variety of engineered components and products for customers worldwide. While Leggett & Platt may not be a familiar name to you, chances are you sleep on a bed made with Leggett components - box spring, innerspring, fiber comfort layers; relax in a recliner that has an L&P motion mechanism powering it; shop in stores that have products displayed on shelving made by L&P - in short, Leggett products are all around you, making the products you use every day more comfortable, durable and life-enhancing.
The earnings and price correlated graph on Leggett & Platt illustrates the cyclical nature of the bedding and furniture industry. Not only is earnings growth very low, it is obviously very unpredictable as well. Nevertheless, Leggett & Platt is considered one of the highest quality companies in this sector. On the other hand, its current valuation is slightly above historical norms.
(Click to enlarge)
The calculated performance chart on Leggett & Platt once again depicts a company where investor appeal rests predominantly on their record of dividend increases. Prior to 1997, Leggett & Platt did produce a decade or more of consistent earnings growth. This explains some of the high rates of dividend growth that shareholders enjoyed from 1997 through 2001. However, as earnings became more cyclical, so did their dividend growth rate. In 2009 they were only able to increase their dividend by a penny in order to keep their streak of dividend growth alive.
(Click to enlarge)
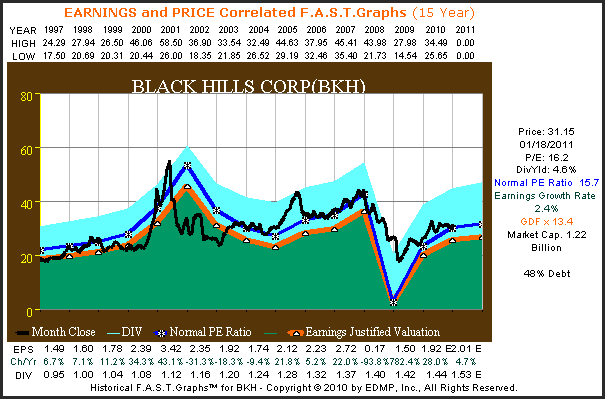
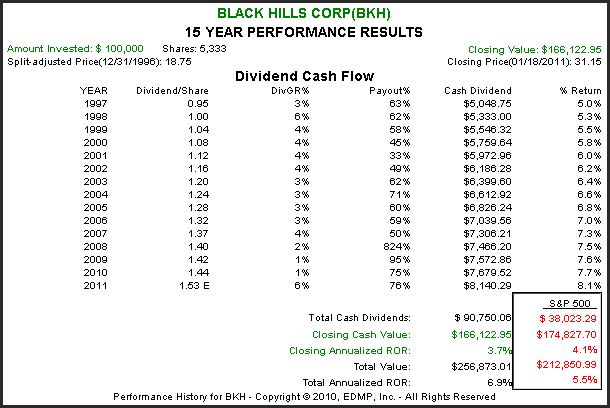
Black Hills Corp. (BKH)
About Black Hills Corp.
Black Hills Corporation is a diversified energy company. The Company operates principally in the United States with two business groups: Utilities and Non-regulated Energy. Its Utilities Group consists of its regulated electric utilities and regulated gas utilities segments, and its Non-regulated Energy Group consists of its oil and gas, power generation, coal mining, and energy marketing segments. The Company’s regulated Electric Utilities segment includes the operations of Cheyenne Light, a combination electric and gas utility, and its approximately 33,900 gas utility customers in Wyoming. Its regulated Gas Utilities segment serves approximately 528,300 natural gas utility customers in Colorado, Nebraska, Iowa and Kansas.
Black Hills Corp. is one more example of a low growth regulated utility. Stock price has historically tracked earnings growth as expected, which is translated into a very weak stock price since the great recession. Current valuation on depressed earnings is about normal for this Western electric utility company.
(Click to enlarge)
The calculated performance chart associated with Black Hills Corp. shows that they had a great deal of difficulty increasing their dividend over the last couple years. Weaker earnings made dividend increases very challenging since 2008. However, the board of directors saw fit to keep their streak alive.
(Click to enlarge)
Summary and conclusions
Recently there has been a lot of discussion about whether dividend paying stocks are better than non-dividend paying stocks, etc. From our point of view, this is just one more example of pointless arguments based on vagaries and generalities. Other examples would be the discussions about whether buy and hold is a good strategy, or arguments that debate passive versus active investing and our all-time favorite that debates growth versus value investing.
The problem with all these arguments is that there are no ironclad specific definitions that are being equally or universally applied by all arguers. Everyone has a different idea of what these terms mean. Consequently, the arguments make no sense because no one is arguing about the same thing. Even worse, the only evidence that anyone is capable of offering is usually based on some statistical analysis or study. And as has already been stated in this article, "statistics don't lie, but statisticians do."
We really like dividend paying stocks and use them in all our portfolios. We even manage portfolios of nothing but dividend paying stocks. However, they have to be the right dividend paying stocks. There are other very important factors that come into play. The most important is earnings growth. More precisely, the velocity or rate of change of earnings growth will be a primary determinant of future return. Keeping in mind that dividends are paid out of earnings, and therefore a function of them.
Valuation is a second component that is extremely important. Dividends themselves are a great attribute that can reduce risk and enhance returns. This assumes, of course, that these other important factors are in alignment.
When reviewing these 10 highest yielding of the 98 Dividend Champions, we discover that total returns since 1997 were in most cases below average. In fact and truth, it was only thanks to dividends that any meaningful return at all was achieved. Therefore, this article serves as a testament to the importance of dividends, especially as a risk mitigator. On the other hand, this analysis does not support the notion that the highest yielding dividend paying stocks will generate the best long-term returns. Our next article will review the 10 lowest yielding Dividend Champions for contrast. The total returns provided by this group may surprise you.
Disclosure: I am long AAPL.
Disclaimer: The opinions in this document are for informational and educational purposes only and should not be construed as a recommendation to buy or sell the stocks mentioned or to solicit transactions or clients. Past performance of the companies discussed may not continue and the companies may not achieve the earnings growth as predicted. The information in this document is believed to be accurate, but under no circumstances should a person act upon the information contained within. We do not recommend that anyone act upon any investment information without first consulting an investment advisor as to the suitability of such investments for his specific situation.
No comments:
Post a Comment