In this part 2 of our articles on the top 14 Dividend Champions that represent the “sweet spot” for total return, we will emphasize capital appreciation over yield. In part 1 of this two-part article, we started out by covering the first seven companies with the highest yields of the group of 14. Consequently, in part 1, we focused more on dividend yield than we did capital appreciation. In this part 2, we will turn our attention more towards the capital appreciation component, but dividends will still be a major focus. This is because we feel that the most important factor that should be gleaned from these articles is the importance of total return, which includes both capital appreciation and dividends.
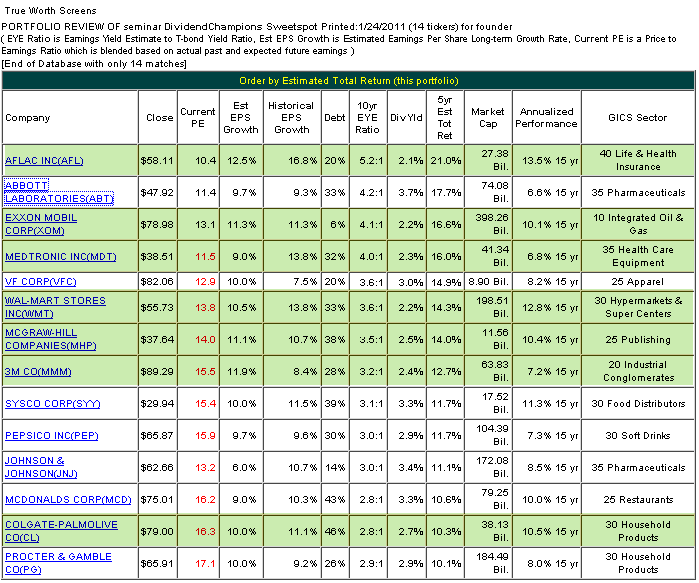
Dividends are great, and we have written about their many advantages in our three previous articles that analyzed key segments of the 98 companies on the Dividend Champions list. Links to all three articles can be found here: Article 1, Article 2, and Article 3. However, with the odds extremely high that we will have inflation in our future, dividends, even growing dividends, may not be enough. The primary reason we refer to this list of 14 Dividend Champions as companies in the sweet spot for total return, is because we believe they offer the best balance of both, growing dividends and above-average capital appreciation potential. For convenience, we repeat the following information on both the Dividend Champions and Standard & Poor's Dividend Aristocrats lists with links. The list of Dividend Champions includes 98 companies that have raised their dividends every year for at least 25 years. This list can be found here courtesy of David Fish. A second excellent source is the Dividend Aristocrats index, available from Standard & Poor's Corp. This index is comprised of 42 large-cap, blue-chip companies within the S&P 500 that have likewise increased their dividend every year for 25 years.(Standard & Poor's Dividend Aristocrats). The following graphs summary and review lists these 14 "sweet spot" candidates in order of highest estimated total return to lowest of the group. Each company covered in all four articles were reviewed since calendar year 1997, which provides an apples to apples time frame comparison. In order to be qualified as a "sweet spot" candidate, each company had to possess the following characteristics and criteria:
- The current dividend yield had to be above average exceeding 2% (S&P 500 average equals 1.8%).
- The historical total return since 1997 had to exceed the S&P 500’s.
- Total cumulative dividend income since 1997 should exceed the S&P 500's.
- Historical earnings-per-share growth had to exceed the S&P 500.
- Debt to equity had to be under 50%, the lower the better.
- Each company had to be an industry-leading large-cap blue-chip.
- Of course, each company had to increase their dividend for at least 25 years consecutively.
- Most importantly, each company had to be attractively valued based on the consensus of leading analysts reporting to FirstCall or Zacks forecasts for five-year future earnings growth.
(Click to enlarge)
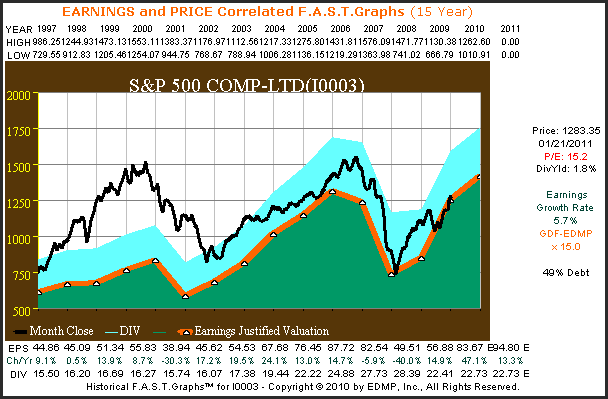
The following "fundamentals at a glance" will review the second seven "sweet spot" candidates highlighted in green above, through the lens of our graphs research tool. Per reader requests, we have included a graphs on the S&P 500 for perspective and as a benchmark comparison. As you review each company's earnings and price correlated graphs, we suggest that you make special note of the consistency of each company's operating record as compared to the average company (S&P 500).
Interpreting the Graphs
Note that there is a legend at the bottom of the historical earnings and price correlated graphs, and a legend to the right of the graphs showing estimated earnings and return calculator. Also, essential information such as price, date, current PE ratios, historical earnings growth rates, the normal PE ratio if calculated, a reference to valuation formulas, market capitalization and finally debt to equity ratios are listed to the right of each historical graphs and color-coded where appropriate.
Similar information will be provided to the right of the forecasting graphs (estimated earnings and return calculator) regarding price, date and current PE ratios, and a reference to the appropriate valuation formula based on forecasts. Additionally, the consensus estimated earnings growth rate and the earnings aggregator (FirstCall or Zacks) to include the number of analysts making up the consensus will be listed.
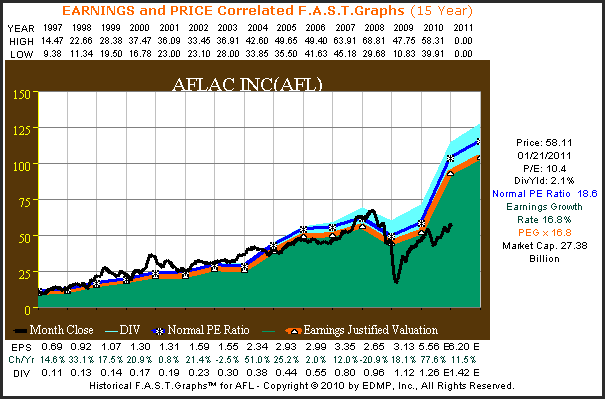
About Aflac Inc.
“When a policyholder gets sick or hurt, Aflac pays cash benefits fast. For 55 years, Aflac insurance policies have helped provide a safety net and given policyholders the opportunity to focus on recovery, not financial stress. In the United States, Aflac is the number one provider of guaranteed-renewable insurance. In Japan, Aflac is the number one insurance company in terms of individual insurance policies in force. Aflac insurance products provide protection to more than 50 million people worldwide.”
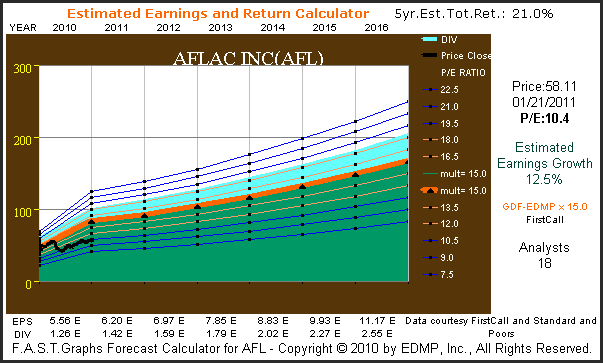
The earnings and price correlated graph on AFLAC Inc. depicts a company with a history of significantly above-average earnings growth. Of special note is how consistently the monthly closing stock price (black line) has tracked the earnings justified valuation line (orange line). AFLAC Inc. has generated very consistent earnings growth considering that it's a financial. Consequently, we feel that the current valuation unfairly punishes this well-run enterprise.
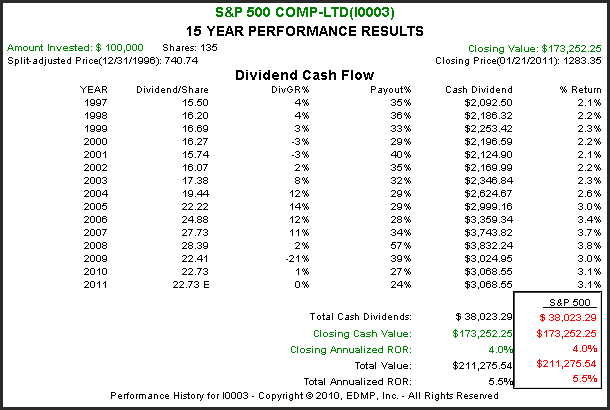
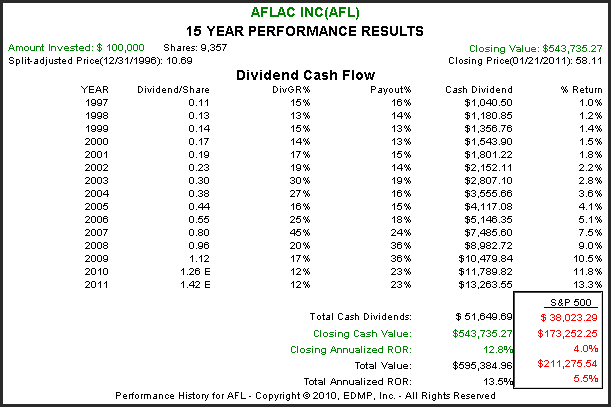
The performance results associated with AFLAC's historical price and earnings correlated graph shows that AFLAC's above-average earnings growth has amply rewarded shareholders in excess of the general market as measured by the S&P 500. Not only has capital appreciation been more than four times the averages, total cash dividends paid also exceeded the S&P 500.
AFLAC's estimated earnings and return calculator graph reports that the consensus of 18 analysts reporting to FirstCall expect a five-year estimated earnings growth of 12.5%. Therefore, AFLAC trades at a valuation that is below the value corridor represented by the five orange lines. If consensus is correct and the market capitalizes their earnings at a more appropriate 15 multiple, future capital appreciation should be above average.
(Click to enlarge)
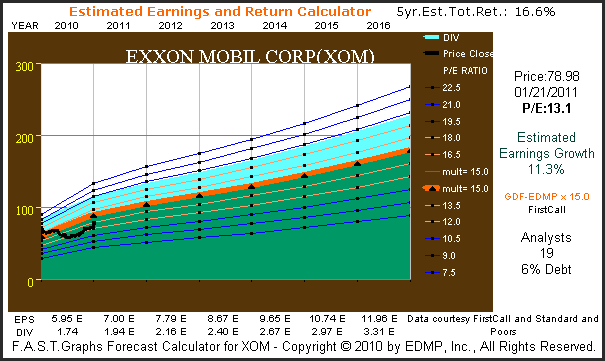
Exxon Mobil Corporation (XOM) About Exxon Mobil
“ExxonMobil is the world’s largest publicly traded international oil and gas company. We hold an industry-leading inventory of global oil and gas resources. We are the world’s largest refiner and marketer of petroleum products. And our chemical company ranks among the world’s largest. But we are also a technology company, applying science and innovation to find better, safer and cleaner ways to deliver the energy the world needs.”
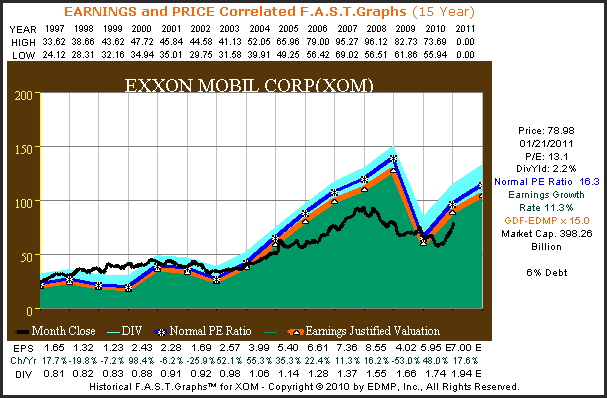
The earnings and price correlated graph on Exxon Mobil Corp. depicts an interesting relationship between earnings and price. Stock prices fell with earnings in 2009, but have since recovered strongly. Nevertheless, Exxon Mobil Corp. currently trades at a PE ratio that is below their historical norm. The current dividend yield of 2.2% is above average and well covered by Exxon's strong cash flow generation and strong debt to equity ratio of 6%.
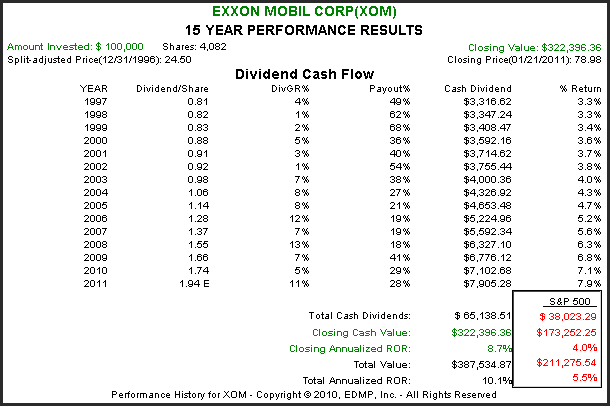
Exxon Mobil Corp.'s above-average earnings growth has allowed them to outperform the S&P 500 on both total cash dividends paid plus a closing cash value that is more than twice the averages. Dividend growth for this blue-chip energy giant has closely tracked earnings growth since 1997.
Exxon Mobil Corp.'s estimated earnings and return calculator graphs shows that the consensus of 16 analysts reporting to FirstCall expect Exxon's next five years earnings growth to be equal to its historical record since 1997. Therefore, due to today's current low valuation, it is not unreasonable to expect that future returns, which include dividend growth, could exceed historical rates.
(Click to enlarge)
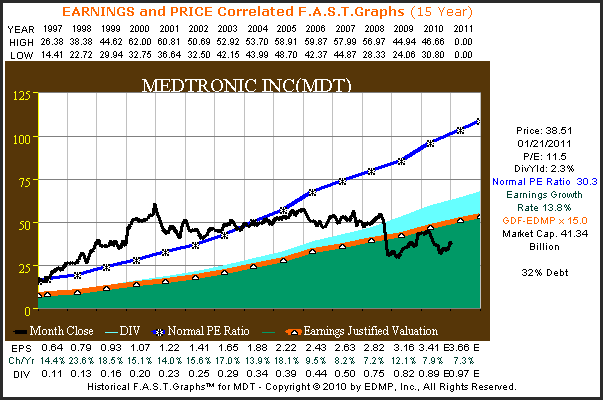
About Medtronic Inc.
“Medtronic, Inc., headquartered in Minneapolis, is the global leader in medical technology – alleviating pain, restoring health, and extending life for millions of people around the world.”
The earnings and price correlated graph on Medtronic Inc. offers a very important lesson on the importance of valuation. From 1997 through year-end 2000, Medtronic’s stock price advanced far in excess of its earnings justified levels (orange line). The resulting overvaluation caused Medtronic’s stock price to be range bound, moving sideways for almost 8 years. Then, the recession of 2008 finally brought Medtronic’s stock price into fair value and then below.
Most importantly, the consistency of their earnings growth remained intact, and above-average throughout it all. Medtronic's historically low valuation today is not really caused by any significant operating stress. Earnings continued to advance right through the recession, although they did moderately slow down. However, neither the overvaluation of years past or today's undervaluation make fundamental sense in our opinion.
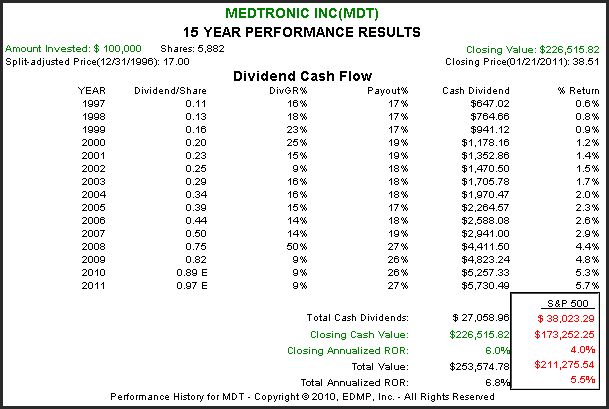
Even though Medtronic stock price fell from being significantly overvalued in recent years, their shareholders were still rewarded in excess of the general market. Note that this is the only company of the 14 "sweet spot" covered companies whose total cash dividends paid did not exceed the S&P 500. However, this is mostly attributed to an overvalued stock price in 1997 and a mid-teens payout ratio that now exceeds 25%.
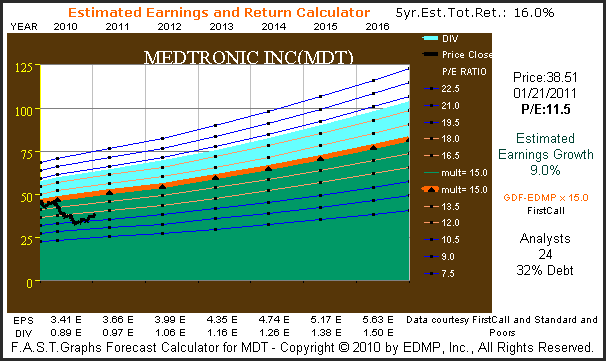
Medtronic Inc.'s estimated earnings and return calculator graphs shows that 24 analysts reporting to FirstCall estimate earnings to grow by 9% over the next five years. We feel that this is a very conservative estimate for this high-quality medical technology company with a strong demographic opportunity. Nevertheless, the current low PE ratio provides a strong entry point, in our opinion. Furthermore, we believe there is a high probability that future earnings growth could exceed current estimates.
(Click to enlarge)
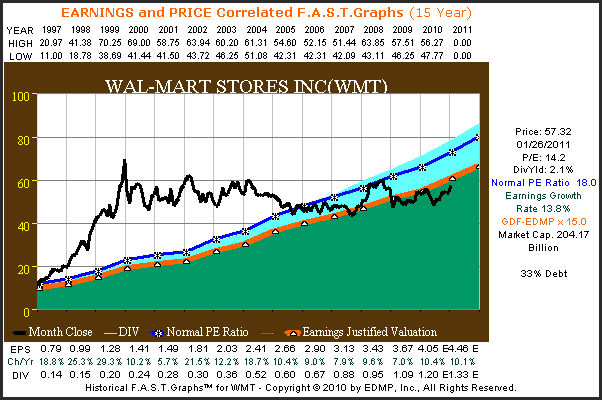
Wal-Mart Stores, Inc. (WMT) About Wal-Mart Stores, Inc.
“Wal-Mart Stores, Inc., serves customers and members more than 200 million times per week at more than 8,600 retail units under 59 different banners in 15 countries. With fiscal year 2010 sales of $405 billion, Walmart employs more than two million associates worldwide. A leader in sustainability, corporate philanthropy and employment opportunity, Walmart ranked first among retailers in Fortune magazine's 2010 Most Admired Companies survey.”
The earnings and price correlated graph on Wal-Mart Stores Inc. offers a second example and lesson on the importance of valuation. In 1997 Wal-Mart started out fairly valued, however, irrational exuberance carried their stock price to unjustified levels by year-end 1999. Once again, earnings continued to advance at a very healthy rate; however, stock price had nowhere to go but sideways and even down as it moved to more rational earnings justified levels (orange line).

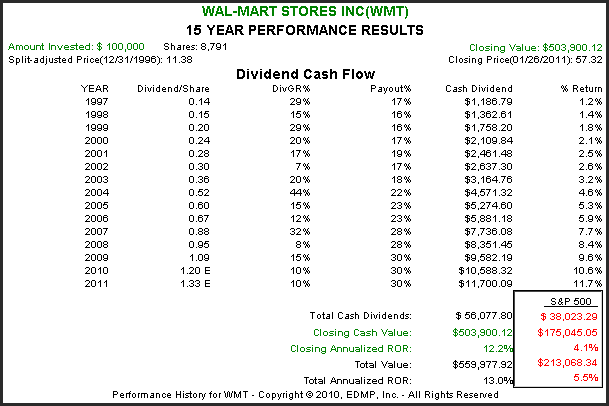
When reviewing the performance associated with the above graphs on Wal-Mart Stores Inc., it's interesting that long-term performance correlated very closely to long-term earnings growth. In 1997 Wal-Mart was approximately fairly valued (a little over) and currently fairly valued (which explains performance slightly less than earnings growth). Nevertheless, for the 14 year period (remember there's one year of forecast on the graph) Wal-Mart's capital appreciation was triple the S&P 500 and the total cash dividends were also greater than average.
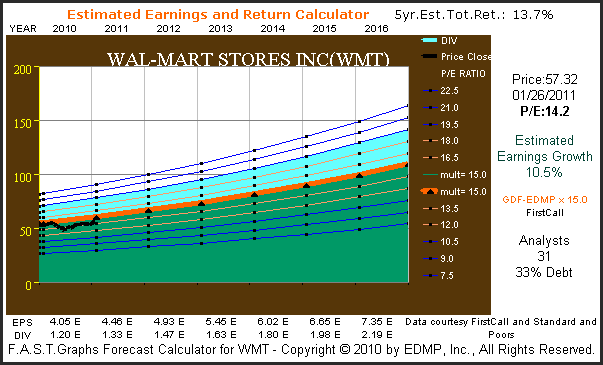
Wal-Mart Stores’ estimated earnings and return calculator graph shows that 31 analysts reporting to FirstCall expect the five-year earnings growth of 10.5%. The earnings justified valuation formula would indicate that this rate of growth should command a PE ratio of 15. Therefore, Wal-Mart appears to be very attractively valued today with the potential to generate double-digit future returns including dividends.
(Click to enlarge)
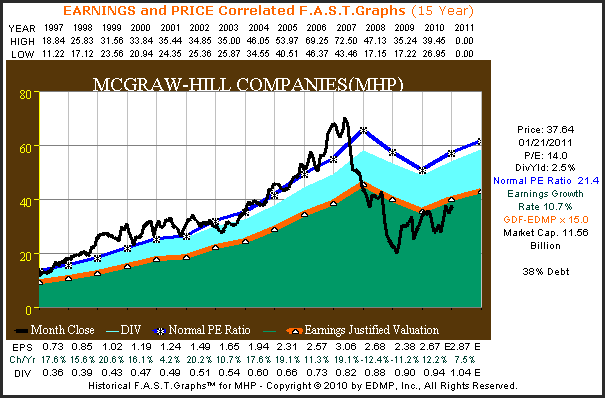
McGraw-Hill Companies (MHP) About McGraw-Hill Companies
“Today, The McGraw-Hill Companies is a global information and education company providing knowledge, insights and analysis in the financial, education and business information sectors through leading brands including Standard & Poor's, McGraw-Hill Education, Platts, and J.D. Power and Associates. With more than 280 offices in 40 countries, the Company is poised to support a new era of global growth by using the latest technologies to help drive 21st century workforce development and to deliver valuable benchmarks and information that help financial and business professionals around the world make better decisions.”
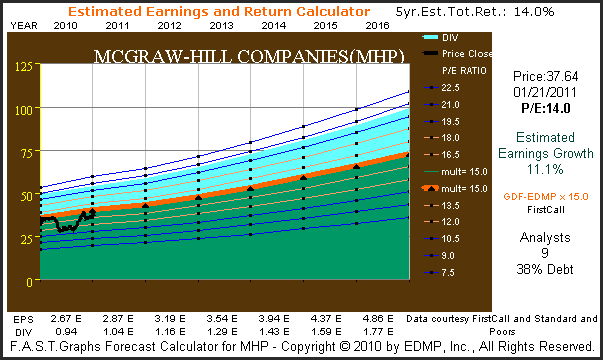
The earnings and price correlated graph on McGraw-Hill Companies depicts a company that the market had routinely placed a premium valuation on up through 2007. However, when the recession of 2008 interrupted their otherwise impeccable earnings growth record, their stock price responded by falling from the mid-70s to just over $17 a share. Nevertheless, McGraw-Hill Companies produced double-digit earnings growth. Today the company appears fairly valued based on earnings.
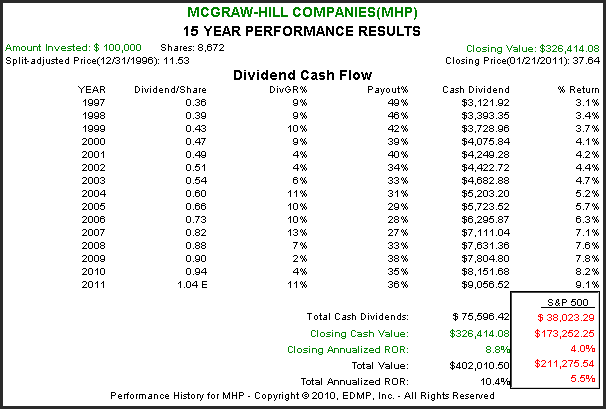
Once again we see an example where strong earnings growth was able to overcome overvaluation and a modest interruption in their earnings record. Notwithstanding these two issues, McGraw-Hill produced capital appreciation more than double the S&P 500 and generated total cash dividends paid that were also almost twice the S&P 500.
McGraw-Hill Companies’ estimated earnings and return calculator graph shows that nine analysts reporting to FirstCall expect five-year earnings growth of 11.1%. This is very similar to McGraw-Hill's historical achievement, and therefore, could be argued that this estimate appears at least reasonable. If accurate, McGraw-Hill Companies would represent a very fairly valued Dividend Champion offering investors an opportunity for above-average total future returns.
(Click to enlarge)
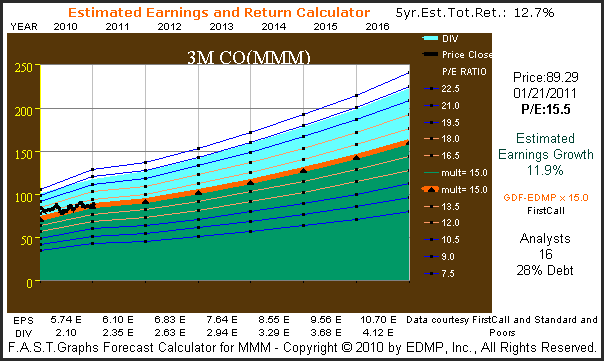
About 3M Company
“3M is fundamentally a science-based company. We produce thousands of imaginative products, and we're a leader in scores of markets – from health care and highway safety to office products and optical films for LCD displays. Our success begins with our ability to apply our technologies – often in combination – to an endless array of real-world customer needs. Of course, all of this is made possible by the people of 3M and their singular commitment to make life easier and better for people around the world.”
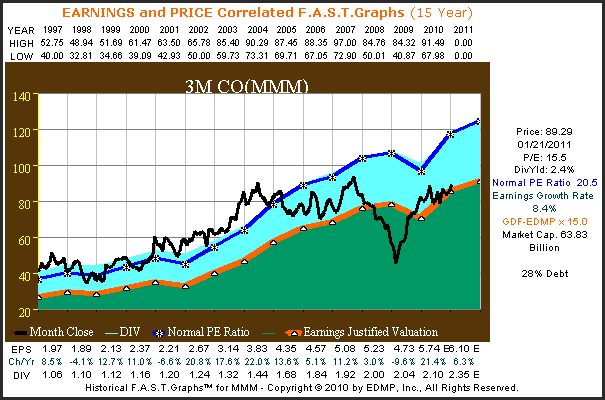
The earnings and price correlated graph on 3M Company depicts that the market has generally applied a premium valuation to this blue-chip. However, since a falling tide sinks all ships, 3M Company suffered a severe drop in stock price in calendar year 2008. However, since earnings held up reasonably well and have recovered to trend line levels in 2010, the stock price has responded accordingly. However, previous lofty valuations have yet to return.
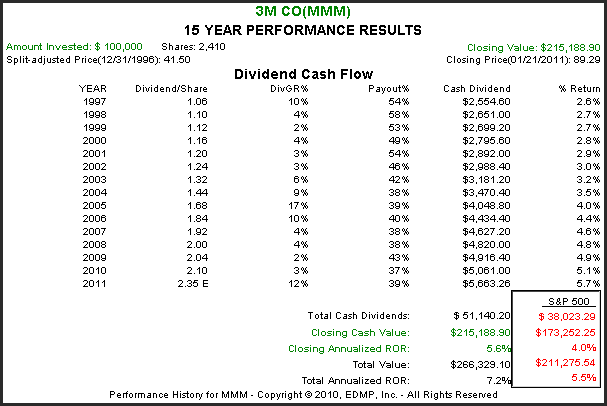
3M Company did generate performance that exceeded the S&P 500 on both a capital appreciation and total dividends paid basis. However, since earnings growth was not as strong as some of the other examples cited in these articles, their excess return was not as strong either.
3M Company's estimated earnings and return calculator graph shows that 16 analysts reporting to FirstCall expect 3M's future five-year earnings growth to exceed its historical average since 1997. It was thanks to this higher forecast earnings growth rate that 3M was included in the Dividend Champion's “sweet spot” list.
(Click to enlarge)
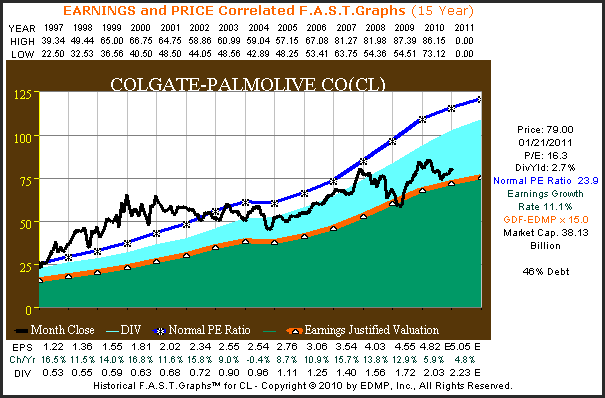
Colgate-Palmolive Co. (CL) About Colgate-Palmolive
“Colgate's long history of steady growth and strong performance comes from a strategy of tight focus on global brands in four core businesses: Oral Care, Personal Care, Home Care and Pet Nutrition.”
The earnings and price correlated graphs on Colgate-Palmolive Co. illustrate a very steady record of above-average earnings growth since 1997. However, Colgate-Palmolive also offers another example of the importance of valuation. Overvaluation in 2000 through 2008 resulted in very poor shareholder returns, even though earnings growth was solid.
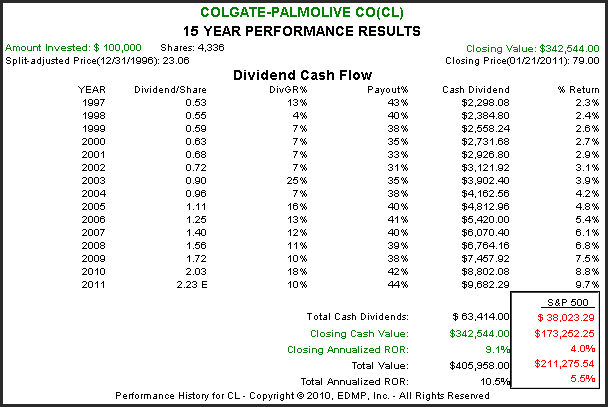
Colgate-Palmolive's performance record was still able to reflect their operating excellence as both total cash dividends and capital appreciation exceeded the S&P 500. Of special note in this example is the consistency of their payout ratio, as well as the correlation of dividend growth to earnings growth.
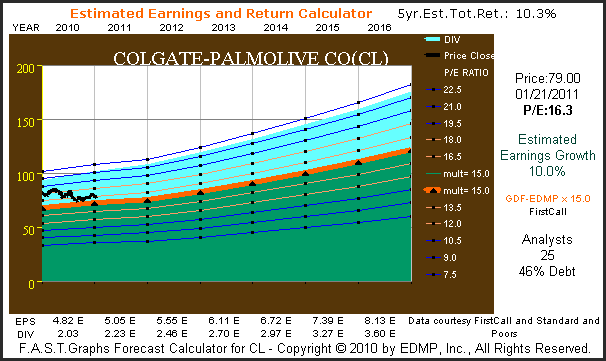
Colgate-Palmolive Company’s estimated earnings and return calculator graph shows that 25 analysts reporting to FirstCall expect five-year earnings growth of 10%. This is consistent with their historical growth, and therefore, appears reasonable. At their current valuation, Colgate-Palmolive appears fairly valued, but valuation is a little higher here than we've seen on other examples.
(Click to enlarge)
Summary and Conclusions
There are many good reasons why investors would want to consider investing in dividend paying stocks. Companies that pay dividends in general have solid cash flows and strong balance sheets. When a company has consecutively increased their dividends for 25 years or more, like the Dividend Champions covered in this series of articles, investor confidence that these increases will continue can be reasonably high. But dividends alone should not represent the final say or be the only factor that investors should consider. There are other important considerations that investors should evaluate and analyze.
The concept of total return is one of the most important considerations that investors need to evaluate. As previously mentioned, inflation is more than likely in front of us. Therefore, the need for growth of both capital and dividend income is essential. Furthermore, it's important to realize that two companies can be paying exactly the same dividend rate, but possess significant different prospects for future growth and returns. In the same vein, it's not just enough that the company has increased dividends every year for 25 years or more, but the rate at which those dividends have grown is a critical piece of information.
Consequently, when evaluating dividend paying stocks, it's important to be cognizant of where dividends come from. Of course, the answer is earnings. Dividends represent a portion of the company's earnings paid out to shareholders. Therefore, as we all know, the more earnings the company has, and the more future earnings they are capable of generating, the more dividends they can send to their shareholders now and in the future. This makes earnings growth equally as important as earnings themselves. Also, the more earnings the company generates the more shareholder value it creates.
The point we are attempting to drive home is very straightforward. Even though dividends are good and important, they should not be sought after to the exclusion of capital appreciation. In this two-part series covering 14 Dividend Champions representing the "sweet spot" for total return, we have evaluated quality examples where we believe investors can find both; growth of capital and growth of dividend income. As always, a comprehensive research effort is suggested, and a disciplined adherence to the principles of sound valuation are mandatory for success.
Disclosure: I am long SYY, VFC, PEP, ABT, JNJ, MCD, PG, CL, MDT, XOM,AFL. 
No comments:
Post a Comment